
- Title
-
Polarized endosome dynamics engage cytoplasmic Par-3 that recruits dynein during asymmetric cell division
- Authors
- Zhao, X., Garcia, J.Q., Tong, K., Chen, X., Yang, B., Li, Q., Dai, Z., Shi, X., Seiple, I.B., Huang, B., Guo, S.
- Source
- Full text @ Sci Adv

Polarized dynamics of Notch ligand–containing endosomes during RGP division.(A) Schematic diagram of a 28-hpf embryo (dorsal view) indicating the site of anti-Delta D-Atto647N (Dld) antibody injection (left). Right: Internalized Dld (blue) imaged 2 hours after antibody injection shows punctate appearance in RGPs (membrane labeled red). FV, forebrain ventricle. (B) Time-lapse imaging of mitotic RGP showing the dynamics of labeled Dld endosomes. Membrane, nucleus, and centrosomes [green fluorescent protein (GFP)–centrin] are marked as shown. (C) Schematic diagram showing typical phases of internalized Dld dynamic patterns in (B). (D) Schematic diagrams and statistics of distribution patterns of Dld endosomes in telophase RGPs (see Materials and Methods for the quantification of asymmetry index). Dotted lines in the scatter plot denote the asymmetric threshold of |0.2|. n = 88 RGPs, from 20 embryos of six experiments. (E) Automated tracking of Dld endosomes. (E1) Plot of time-lapse data from a composite of 19 RGPs. Each dot represents a tracked endosome at a given time. Color codes for cell cycle stages. The blue vertical line denoting the midpoint between two centrosomes is used for image registration. (E2 and E3) The plot trajectory of a singly labeled Dld endosome in two RGPs. Time is registered and color-coded (anaphase, T = 0). A-P, anteroposterior; Ap-Ba, apicobasal. In all images/plots, maximum intensity projection (MIP) of 5-μm z-stacks (1-μm z-step) is shown. The time interval between each z-stack is 12 s. |
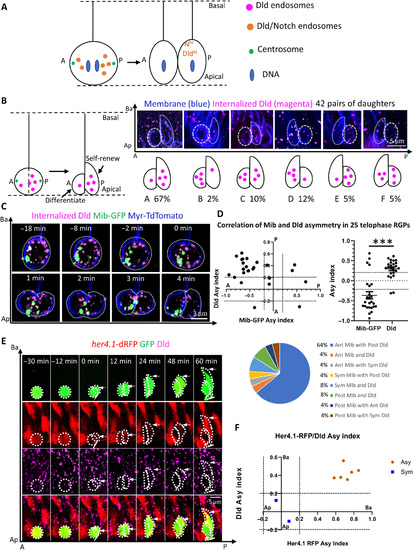
Dld endosomes are preferentially segregated into the Notchhi daughter following RGP division.(A) Schematic depicting the asymmetry of Dld endosomes (Dldhi) and Notch activity (Nhi) in daughter cells. (B) Topology and statistics of relative daughter cell position along A-P (anteroposterior) and Ap-Ba (apicobasal) axes after horizontal division. MIP of 5-μm z-stacks (1-μm z-step) is shown. (C) Time-lapse images showing that Dld endosomes and Mib are segregated into different daughter cells following RGP division (n = 25). MIP of 5-μm z-stacks (1-μm z-step) is shown. The time interval between z-stacks is 20 s, and the total acquisition time is 30 min. (D) The top left graph plots individual RGP’s asymmetry indices for Mib-GFP (x axis) and internalized Dld (y axis). The top right graph shows the distribution of asymmetry indices for Mib-GFP and Dld endosomes; the dotted lines indicate the threshold of |0.2| for calling asymmetry. ***P < 0.0001, t = 6.549, df = 48, n = 25; unpaired two tailed t test. Mean with SEM is shown. The bottom pie chart shows the percentage of RGPs with indicated distribution patterns. n = 25 RGPs, from eight embryos of five repeat experiments. (E) Time-lapse images of a clonally labeled RGP (green) showing preferential segregation of internalized Dld to her4.1-dRFPhi daughter. MIP of 8-μm z-stacks (1-μm z-step) is shown. The time interval between z-stacks is 6 min, and the total acquisition time is ~10 hours. (F) Plot for quantifying her4.1-dRFP and internalized Dld in daughter RGPs 1 hour after anaphase. n = 8 RGPs, from eight embryos of six repeat experiments. |

Dld endosome asymmetry is dependent on Par-3 and the dynein motor machinery.(A to D) Time-lapse sequence of images showing Dld endosome dynamics in mitotic RGPs from 28-hpf control MO (A) and embryos deficient for par-3 activity (B), treated with the dynein inhibitor CBD (C), deficient for dynein intermediate light chain 1 (dlic1) (D). Centrosomes are labeled with GFP-centrin, and membrane is labeled with Myr-TdTomato reporter. For (A) to (D), all images shown are the MIP of five confocal z-stacks (1−μm z-step). The time interval between each volume of z-stacks is 15 s, and the total acquisition time is 25 min. (E) Kymograph of horizontal projection of (A) to (D) showing distribution of all tracked Dld endosomes along the anteroposterior (A-P) axis (x) over time (y). The red line delineates center point of the axis defined by two centrosomes. (F) Scatter plot showing asymmetry indices in telophase RGPs. Thirty-three control MO RGPs were from 25 embryos of eight repeat experiments, 22 par-3 MO RGPs were from 9 embryos of six repeat experiments, 15 CBD-treated RGPs were from 7 embryos of four repeat experiments, and 15 dlic1 MO RGPs were from 8 embryos of four repeat experiments. The unpaired two tailed t test shows significance between ctrl versus par-3 MO, ****P < 0.0001 (t = 4.706, df = 53); ctrl MO versus CBD, *P = 0.0129 (t = 2.589, df = 46); ctrl versus dlic1 MO **P = 0.0007 (t = 3.645, df = 46). Mean with SEM is shown for each group. (G) Bar graph showing the percentage of RGPs with different patterns of internalized Dld distribution. Disruption of either Par-3 or dynein activity results in a significant decrease of asymmetric posterior Dld segregation. ****P < 0.0001, χ2 test (chi-square = 95.62, df = 6). |

Preferential segregation of Par-3 and internalized Dld to the posterior daughter following horizontal RGP division.Time-lapse sequence of images showing the dynamics of internalized Dld and Par-3-GFP in mitotic RGPs. DNA is marked by H2B-RFP (pseudo-colored in blue). Time = 2 min denotes telophase when asymmetry indices are calculated. (A) Both internalized Dld and Par-3-GFP are asymmetrically segregated to the posterior daughter shortly after division. (B) Both internalized Dld and Par-3-GFP appear symmetrically distributed shortly after division. (C) Both internalized Dld and Par-3-GFP appear asymmetrically segregated into the anterior daughter shortly after division. For (A) to (C), all images shown are the maximum MIP of five confocal z-stacks (1-μm z-step). The time interval between each volume of z-stacks is 30 s, and the total acquisition time is 30 min. (D) Quantification. Left: The asymmetry indices of Par-3-GFP (x axis) and internalized Dld (y axis) in 54 horizontally dividing RGPs. The dotted lines indicate the threshold of |0.2| for calling asymmetry. Right: Pie charts show the percentage of RGPs with different patterns of Par-3-GFP (top), and Par-3-GFP and internalized Dld (bottom) in 54 horizontally dividing RGPs. Most of the RGPs (64.8%) asymmetrically segregate Par-3 to the posterior daughter. Likewise, most of the RGPs (59.2%) asymmetrically segregate both Par-3 and Dld to the posterior daughter. Other minor classes of RGPs displaying different patterns of segregation might reflect real biological heterogeneity or noise due to mosaic nature of Dld labeling. The 54 RGPs are from 15 embryos in eight repeat experiments. |

Cytosolic Par-3 together with Dlic1 decorates Dld endosomes.(A) Immunostained anaphase RGP. The green box denotes the area for colocalization analysis (60 × 100 pixels, 0.126-μm pixel size). The white arrows indicate the overlapped cytosolic staining. The MIP of 10 z-planes (0.2-μm z-step) is shown. (B) Quantification of colocalization coefficients (see Materials and Methods) in RGPs. Dld and Dlic1 colocalization is significantly reduced in the par-3–deficient (par-3 MO) RGPs (n = 18, from six embryos of four repeat experiments) compared with control RGPs (n = 20, from five embryos of four repeat experiments). *P < 0.0001 (Dld co. Dlic1, t = 9.56 and df =36; Dlic1 co. Dld, t = 7.27 and df = 36), unpaired two-tailed t test. In the par-3 knockdown RGPs rescued with Par-3-GFP mRNA (par-3 MO + Par-3-GFP mRNA, n = 17, from eight embryos of four repeat experiments), Dld and Dlic1 colocalizations are significantly restored. *P < 0.0001 (Dld co. Dlic1, t = 8.252 and df = 33; Dlic1 co. Dld, t =10.57 and df = 33), unpaired two-tailed t test. Mean with SEM is shown. (C) Left: LR-ExM of anaphase RGP from 28-hpf embryo (par-3-GFP mRNA injected at 16-cell stage and anti–Dld-Atto647 uptake at 26 hpf). Scale bars denote the real biological size. The MIP of 10 z-planes is shown. Right: Enlarged view (MIP of four z-planes) of the endosomal structure (dotted ring-like) containing Dld. Z-step = 0.26 μm. (D) Statistics of the colocalization coefficient of anti–Par-3, anti-Dlic1, and internalized Dld fluorescence in 14 RGPs (from six embryos of four repeat experiments) processed by LR-ExM. Mean with SEM is shown. (E) Summary model. D/N, delta and Notch; CEN, centrosome; MT, microtubule. |