
- Title
-
Evolution after whole genome duplication: teleost microRNAs
- Authors
- Desvignes, T., Sydes, J., Montfort, J., Bobe, J., Postlethwait, J.H.
- Source
- Full text @ Mol Bio Evol

Evolution of the actinopterygian miRNA repertoire. (A) miRNA repertoire composition in spotted gar, zebrafish, medaka, stickleback, and blackfin icefish. Each pie chart represents the proportion of miRNA genes present in singleton (orange), in TGD ohnolog pairs (blue), or lost (gray). The last common ancestors of each lineage were reconstructed by maximum parsimony and divergence times were based on TimeTree (Kumar et al. 2017). The teleost genome duplication (TGD) was assumed to have happened at the estimated divergence time of Holostei and Teleosts. (B) Terminology and schematic representation of miRNA gene relationships between gar and teleosts following the TGD. (C) Overlap of miRNA gene orthologs across the four studied teleosts. (D) Color-coded miRNA gene loss rates in genes per 10 My mapped on each branch of a time-calibrated tree (Kumar et al. 2017). |
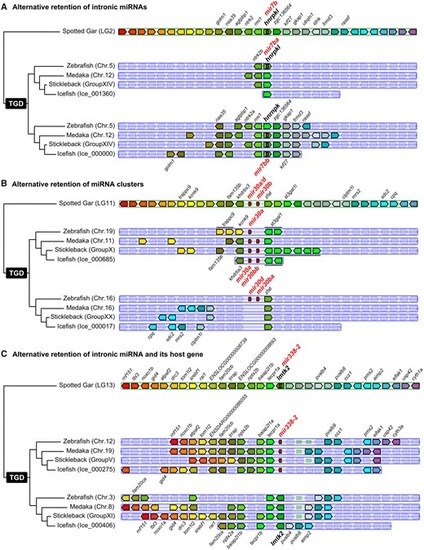
Examples of miRNA retention after the TGD. (A) Alternative retention of intronic miRNA mir7b between zebrafish and acanthomorphs. (B) Alternative retention of miRNA clusters mir30a/d-mir30b between zebrafish and acanthomorphs. (C) Alternative retention of intronic miRNA mir338-2 and host gene lmtk2 in teleosts. Synteny analyses were performed using Genomicus version 96.01 (Muffato et al. 2010). The blackfin icefish was manually added using the annotation of the published genome (Kim et al. 2019). |
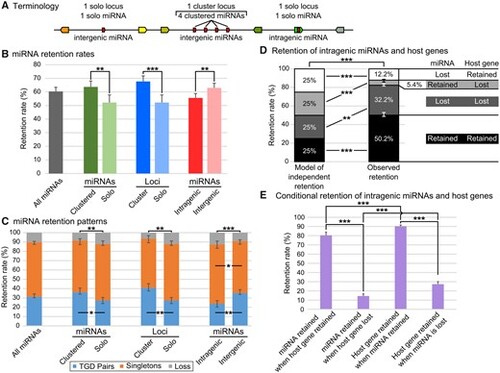
miRNA gene retention rates and patterns following the TGD varied depending on genetic context. (A) Schematic representation of terminology used for clustered miRNAs and solo miRNAs, cluster loci and solo loci, intergenic and intragenic miRNAs. (B) Retention rates of post-TGD miRNAs depending on genomic context. (C) Retention patterns of post-TGD miRNAs depending on genomic context. (D) Patterns of retention and loss of miRNAs and host genes compared with a model of independent retention. (E) Influence of the retention or the loss of a member of the miRNA/host pair on the retention of the second member of the pair. Significant differences: *P < 0.05; **P < 0.01; ***P < 0.001. |

miRNA differential expression and organ-enrichment conservation in spotted gar brain, heart, testis, and ovary. (A) Heat map showing the number of gar mature miRNAs overexpressed in each organ compared with each other organ along with (B) a sample-similarity plot that compares each sample with the other seven samples tested. (C) Heat map of 114 gar mature miRNAs (in rows) that were consistently enriched in one organ (in columns) compared with the three other organs, or in gonads compared with brain and heart. Names of gar organ-enriched miRNAs that are enriched in the same organ in zebrafish and stickleback are labeled in red, gar organ-enriched miRNAs that are enriched in the same organ in zebrafish or stickleback are labeled in blue, and miRNAs that are organ-enriched only in gar are labeled in black. |

Expression patterns of selected miRNAs in spotted gar, zebrafish, medaka, and stickleback. Average expression of evolutionarily conserved, organ-enriched miRNAs. Expression levels are given in RPM (reads per million) for the four organs studied in gar, zebrafish, medaka, and stickleback. Associated SDs across biological replicates are provided for gar, zebrafish, and stickleback. |

Expression patterns of major strands of miRNAs composing the mir200 clusters. (A) Orthology relationships (approximate genomic locations in parentheses) and (B) organization of mir200 clusters in each studied species aligned with (C) the average expression of each major strand given in RPM (reads per million) for the four organs studied in gar, zebrafish, medaka, and stickleback. Associated SDs across biological replicates are provided for gar, zebrafish, and stickleback. |

Global pattern of sequence evolution between ohnologous mature miRNAs. (A) Each strand in a hairpin was qualified as either major or minor depending on its relative expression compared with the complementary strand of the hairpin. Blue and red horizontal bars illustrate relative expression patterns (in analogy to aligned reads). Strands that were not expressed were qualified as missing. (B) Ohnologous mature miRNA pairs were further qualified as major strand pairs, minor strand pairs, and missing strand pairs depending on the qualification of each of the mature miRNA of the ohnologous pair. (C) Percentage of ohnologous miRNA strand pairs that were composed of identical miRNAs. Values represent teleost averages with SD for major, minor, and missing strand pairs. (D) Average number of single-nucleotide polymorphisms (SNPs) in ohnologous strand pairs that were not identical. Values represent teleost averages with SDs for major, minor, and missing strand pairs. Different letters signify significant differences at P < 0.05. |
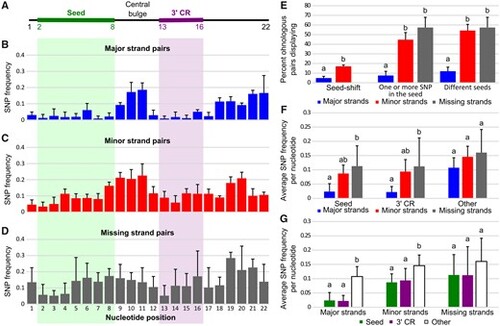
Sequence evolution of ohnologous mature miRNAs. (A) Schematic representation of a generalized 22 nucleotide long miRNA with the seed and 3′-complementary sequence regions (3′-CR) marked by green and purple bars, respectively. (B–D) Single-nucleotide polymorphism (SNP) frequencies at each nucleotide position in major, minor, and missing ohnologous strand pairs. Values represent averages across all four studied teleost species with associated SDs. (E) Frequency of major, minor, and missing nonidentical strand pairs displaying seed-shifts, SNPs in their seed, and different seeds. Values represent averages across the four studied teleost species with associated SDs. (F) SNP frequency per nucleotide in the seed, the 3′-CR, and other nucleotides (i.e., nucleotides 1, 9–12, and 17–22) of major, minor, and missing nonidentical strand pairs. Values represent averages across the four studied teleost species with associated SDs. (G) SNP frequency per nucleotide in major, minor, and missing nonidentical strand pairs for the seed, the 3′-CR, and other nucleotides. Values represent averages across the four studied teleost species with associated SDs. Different letters signify significant differences at P < 0.05. |

Examples of arm-switching events between species. Average expression of each strand in each organ is given in RPM (reads per million) on logarithmic scales for the four organs studied in gar, zebrafish, medaka, and stickleback. The solid line represents equal expression of 5p and 3p strands. Dashed lines represent 2-fold expression difference between one strand and the other. On each graph, points in the top-left half represent organs in which the 3p strand is more expressed than the 5p strand, and points in the bottom-right half represent organs in which the 5p strand is more expressed than the 3p strand. |
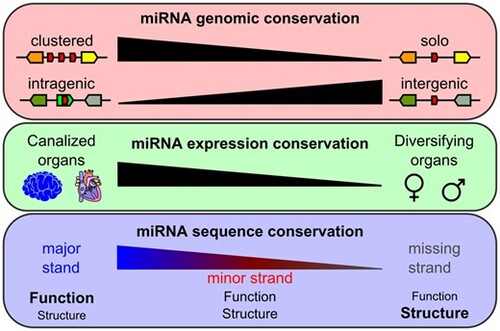
Factors influencing miRNA evolution after the TGD. |