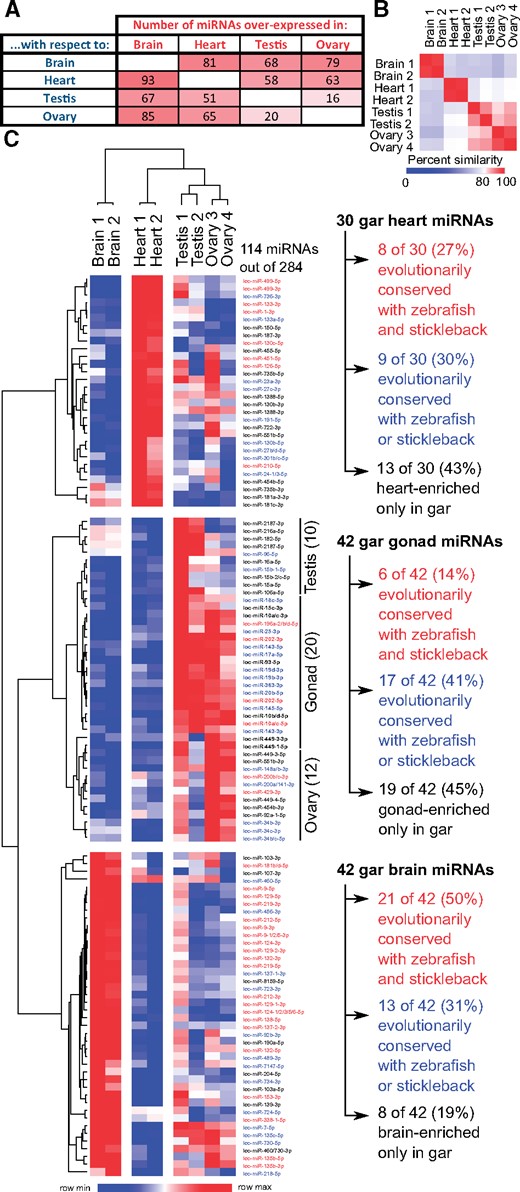
Fig. 4 miRNA differential expression and organ-enrichment conservation in spotted gar brain, heart, testis, and ovary. (A) Heat map showing the number of gar mature miRNAs overexpressed in each organ compared with each other organ along with (B) a sample-similarity plot that compares each sample with the other seven samples tested. (C) Heat map of 114 gar mature miRNAs (in rows) that were consistently enriched in one organ (in columns) compared with the three other organs, or in gonads compared with brain and heart. Names of gar organ-enriched miRNAs that are enriched in the same organ in zebrafish and stickleback are labeled in red, gar organ-enriched miRNAs that are enriched in the same organ in zebrafish or stickleback are labeled in blue, and miRNAs that are organ-enriched only in gar are labeled in black.
Image
Figure Caption
Acknowledgments
This image is the copyrighted work of the attributed author or publisher, and
ZFIN has permission only to display this image to its users.
Additional permissions should be obtained from the applicable author or publisher of the image.
Full text @ Mol Bio Evol

