
- Title
-
Primary cilia are present on endothelial cells of the hyaloid vasculature but are not required for the development of the blood-retinal barrier
- Authors
- Pollock, L.M., Perkins, B., Anand-Apte, B.
- Source
- Full text @ PLoS One
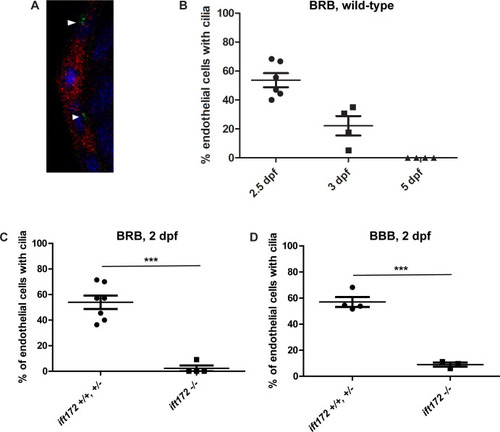
A) Confocal micrograph of the hyaloid vessels (red) of a 3 dpf |

Fluorescent micrographs of the hyaloid vessels in live 6 dpf IFT mutant and wild-type |

Embryos were screened daily for ICH and BRB integrity was assessed at 5 dpf. (A) Average percentages of |

Zebrafish embryos were treated with 1 μM cyclopamine starting at 25 hpf. (A) Percentages of cyclopamine-treated IFT mutant and non-mutant embryos that developed ICH by 52 hpf. No significant differences were detected between mutants and non-mutants by Fisher’s exact test (p > 0.05). (B) Image of a 6 dpf wild-type fish that had cyclopamine-induced pericardial edema (arrow). (C) Fluorescent micrograph of the eye of a zebrafish treated with 1 μM cyclopamine from 1 to 6 dpf, demonstrating an intact blood-retinal barrier. (D) Fluorescent micrograph of a 5 μM cyclopamine-treated zebrafish at 6 dpf with non-perfusion of the hyaloid vasculature (arrowhead). Scale bars = 50 μm. |

Zebrafish larvae were treated with 10 μM cyclopamine from 5 dpf– 7 dpf. (A) Cyclopamine-treated larvae had BRB breakdown at 7 dpf, as seen by the detection of DBP-EGFP (green) outside of the hyaloid vessels (red). Arrowhead indicates autofluorecence. (B) Fluorescent micrograph of a cyclopamine-treated zebrafish at 7 dpf with edema around the eye (arrow), and non-perfusion of the hyaloid vasculature (arrowhead). (C) Graph depicting the percentage of WT and Ift mutant fish in each clutch with edema/non-perfusion after treatment with 10 μM cyclopamine from 5 dpf– 7 dpf (differences between mutants and their non-mutant siblings not significant by Student’s t-test). (D) Graph depicting the percentage of WT and Ift mutant fish in clutches without edema/non-perfusion that had BRB breakdown upon treatment with 10 μM cyclopamine or 1% DMSO vehicle control (***p < 0.0005, all other differences not significant by Student’s t-test). Each data point in (C) and (D) represents a clutch of >50 larvae. Error bars represent SEM. Scale bars = 50 μm. |