FIGURE SUMMARY
Title

Conformational dynamics modulate the catalytic activity of the molecular chaperone Hsp90

Authors
Mader, S.L., Lopez, A., Lawatscheck, J., Luo, Q., Rutz, D.A., Gamiz-Hernandez, A.P., Sattler, M., Buchner, J., Kaila, V.R.I.
Source
Full text @ Nat. Commun.

Structure of the yeast Hsp90 dimer (PDB ID: 2CG9)<sup><xref rid='CR9' ref-type='bibr'>9</xref></sup>.

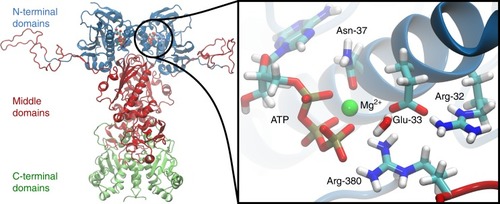
The N-terminal domains of Hsp90 are shown in blue, the middle domains in red, and the C-terminal domains in green. The inset shows a structure of the active site with a bound ATP molecule obtained from an MD simulation, where Asn-37 undergoes a rotation to form a stronger coordination to the magnesium.

Energetics and dynamics of ATP hydrolysis in Hsp90.

a Reactant, transition state (TS), and product structures showing ATP, Mg2+ (in green), and the sidechain of Glu-33 (E33), extracted from QM/MM calculations of the ATP-hydrolysis reaction. QM/MM free-energy profiles were calculated with the Arg-32/Glu-33 ion pair closed (black, rR32-E33 < 5 Å) and open (blue, rR32-E33 > 5 Å, see Fig. 3), as well as for the R32A mutant (red). b The reaction coordinate used for QM/MM calculations is R = r4 − r3 + r2 − r1, a linear combination of distances between Glu-33, the attacking water molecule, and the γ-phosphate of ATP. r2 – r1 is the difference between the bond-breaking (r2) and bond forming (r1) distances for the proton transfer from the water molecule to Glu-33. r4 – r3 is the difference between the bond-breaking (r4) and bond forming (r3) distances for the phosphate cleavage27, 28. The reaction coordinate was optimized from reactants (R = −2.9 Å) to products (R = 2.6 Å). c Semi-concerted ATP-hydrolysis mechanism from QM/MM free-energy calculations (red dots) and during reaction path optimization (blue dots), showing the sampled reaction coordinates with the Arg-32/Glu-33 ion pair closed. The transition state (TS) of the reaction path optimization is marked with a black circle.

Analysis of the catalytic effects in Hsp90.

a Energy decomposition of the catalytic effects. The figure shows the energy difference relative to the wild-type calculation, obtained by switching off individual residue contributions, with the transition state (TS) region marked in yellow (see also Supplementary Fig. 3). b Reaction barrier for ATP hydrolysis at different Arg-32/Glu-33 distances (see also Supplementary Fig. 4). The energy barrier is ca. 20 kcal mol−1 in the DFT models and thus slightly lower as compared with the QM/MM models with explicit treatment of the protein surroundings. c Arg-32/Glu-33 distance from MD simulations of the full-length Hsp90 dimer (in blue and black) and for the monomeric NM-domain model of Hsp90 (in cyan). All Arg-32/Glu-33 distances are measured between the Cζ (Arg-32) and Cδ (Glu-33).

Biophysical characterization of Hsp90.

a Arg-32/Glu-33 distance from classical atomistic MD simulations, showing that the ion pair is closed in the apo-form (purple) of the Hsp90-NTD and its conformation is sensitive to nucleotide binding (ADP in grey/ATP in blue). b1H-15N-HSQC spectra of the Hsp90-NTD bound to ADP (grey) and ATP (blue), with close-ups of the resonances corresponding to the Arg-32 amide group (bottom right) and its sidechain Hε-Nε (bottom left), for which the 1H traces are also included (apo shown in purple). c NOE cross-peak between Arg-32 Hε and Glu-33 Hβ in the apo-NTD, confirming the spatial proximity of the sidechains. d Left: chemical shift perturbations (CSPs) of the Hsp90-NTD bound to ADP and ATP. Negative bars represent residues that could not be assigned due to conformational dynamics. Secondary structure elements are shown on the top and altered residues next to Arg-32 are highlighted in red. Right: distribution of CSP on the NTD for ATP/ADP exchange. Amides of residues that are not visible due to conformational dynamics are represented by blue spheres, whereas unassigned residues are shown in cyan. e FRET experiments show that closing (left) in Hsp90-R32A (in red and light blue) takes place to a smaller extent in comparison with the wild type (WT, in black and orange). Right: re-opening of the closed dimer takes place faster in Hsp90-R32A (red) than in WT Hsp90 (black). The schematic figure on the top illustrates the experimental procedure. f Rates for closing and re-opening of WT Hsp90 and Hsp90-R32A obtained from mono-exponential fitting of the FRET curves shown in e. Error bars represent SD from three independent measurements (n = 3), shown as black dots. Statistical significance was assessed using a two-sided two-sample t-test and a level of significance of 0.01 (**) and 0.001 (***). The fit yields a higher closure rate for R32A relative to WT Hsp90. g ADP-release assays show that WT Hsp90 and Hsp90-R32A have similar global ATP turnover. Error bars represent SD from three independent measurements (n = 3), shown as black dots. Source data are provided as a source data file.

Characterization of the Hsp90 dimer by FRET and SAXS experiments.

a Chase experiments with the closed wild type (WT, left) and R32A (right) Hsp90 dimers in the apo-form and bound to different nucleotides (ATP, AMP-PNP, ATPγS). Chase experiments were initiated by addition of unlabelled Hsp90. b Left: pair distance distributions (P(r)) obtained from the SAXS profiles of apo wild-type (WT) Hsp90 (purple) and bound to different nucleotides (ADP, ATP, AMP-PNP). The P(r) distribution calculated from the X-ray structure of Hsp90 in the closed conformation (PDB ID: 2CG9)9 is shown for comparison (in black). Right: pair distance distributions of the R32A variant in different nucleotide states. AMP-PNP favours a compact conformation of wild-type (WT) Hsp90, whereas the R32A variant shows no major conformational rearrangements.

Acknowledgments
This image is the copyrighted work of the attributed author or publisher, and ZFIN has permission only to display this image to its users. Additional permissions should be obtained from the applicable author or publisher of the image. Full text @ Nat. Commun.