IMAGE

Fig. 3

ID
ZDB-IMAGE-200728-16
Source
Figures for Mader et al., 2020
Image
Figure Caption

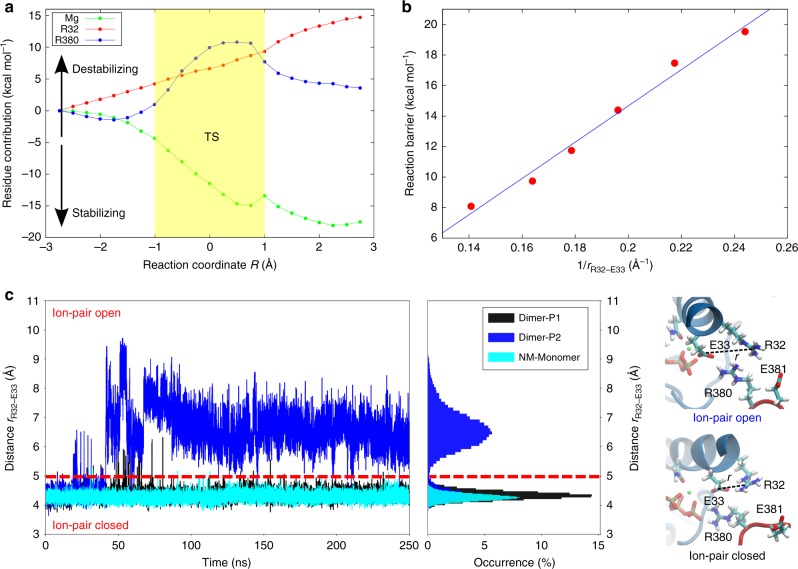
Fig. 3 Analysis of the catalytic effects in Hsp90.

a Energy decomposition of the catalytic effects. The figure shows the energy difference relative to the wild-type calculation, obtained by switching off individual residue contributions, with the transition state (TS) region marked in yellow (see also Supplementary Fig. 3). b Reaction barrier for ATP hydrolysis at different Arg-32/Glu-33 distances (see also Supplementary Fig. 4). The energy barrier is ca. 20 kcal mol−1 in the DFT models and thus slightly lower as compared with the QM/MM models with explicit treatment of the protein surroundings. c Arg-32/Glu-33 distance from MD simulations of the full-length Hsp90 dimer (in blue and black) and for the monomeric NM-domain model of Hsp90 (in cyan). All Arg-32/Glu-33 distances are measured between the Cζ (Arg-32) and Cδ (Glu-33).

Acknowledgments
This image is the copyrighted work of the attributed author or publisher, and ZFIN has permission only to display this image to its users. Additional permissions should be obtained from the applicable author or publisher of the image. Full text @ Nat. Commun.