- Title
-
Zebrafish Model for Non-Syndromic X-linked Sensorineural Deafness, DFNX1
- Authors
- DeSmidt, A.A., Zou, B., Grati, M., Yan, D., Mittal, R., Yao, Q., Richmond, M.T., Denyer, S., Liu, X.Z., Lu, Z.
- Source
- Full text @ Anat. Rec. (Hoboken)
|
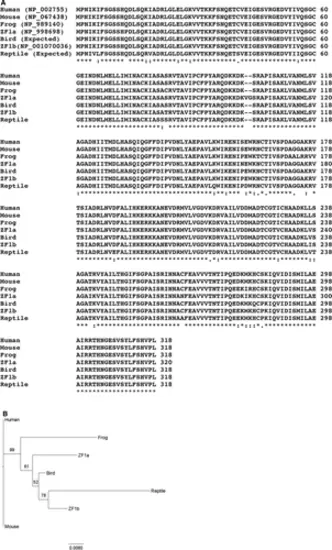
(A) Comparison of amino acid sequences of phosphoribosylpyrophosphate synthetase 1 of vertebrate groups. Bird: Taeniopygia guttata, reptile: Anole carolinensis, frog: Xenopus tropicalis, and ZF: Danio rerio. “*”: amino acids are identical, “:”: amino acids are different but the function is conserved, “.”: amino acids are different but the function is semiconserved, and space: amino acids are different and there is no conservation of function. The sequence alignment was conducted using ClustalW2.1 online software (Larkin et al., 2007). (B) Phylogram of sequences of phosphoribosylpyrophosphate synthetase 1 of vertebrate groups shown in A. The phylogram was constructed with the (Randomized Axelerated Maximum Likelihood, RAxML) program using the “protgammalg” model (Stamatakis, 2014). Bootstrap support values are depicted on the tree. The scale bar indicates the number of amino acid substitutions per site. |
|
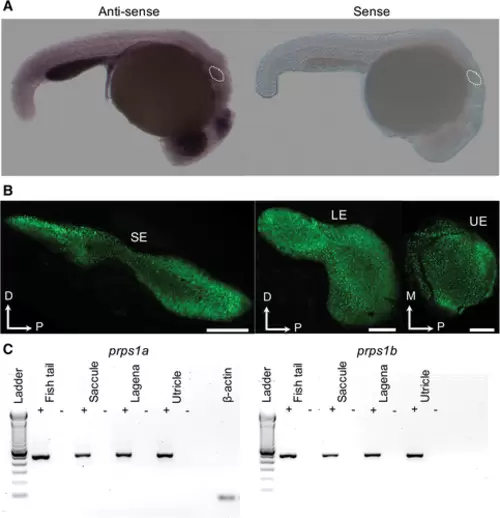
(A) The prps1a expression in the otic vesicle of zebrafish. In situ hybridization whole mounts of 1-dpf zebrafish (wild-type AB) with the prps1a antisense (left) and sense (right) mRNA probes. With the prps1a antisense probe, specific moderate expression was observed in the entire embryo body, with more intense signals seen in the eyes, brain, gut, and otic vesicles, compared with the sense probe stain. The otic vesicles of the embryos are marked by dots. (B) Saccular epithelium (SE), lagenar epithelium (LE), and utricular epithelium (UE) of otolith organs of Et(krt4:GFP) sqet4 adult zebrafish. Green dots in the epithelia are hair cell bodies expressing GFP. D, dorsal; M, medial; and P, posterior. Scale bar = 100 μm. (C) DNA gels of RT-PCR products from saccular, utricular, and lagenar epithelia of the Et(krt4:GFP) sqet4 adult zebrafish, showing the prps1a and prps1b expression in all three sensory epithelia of otolith organs. +: with reverse transcriptase, and –: without reverse transcriptase. ß-actin was used as a positive control. |
|
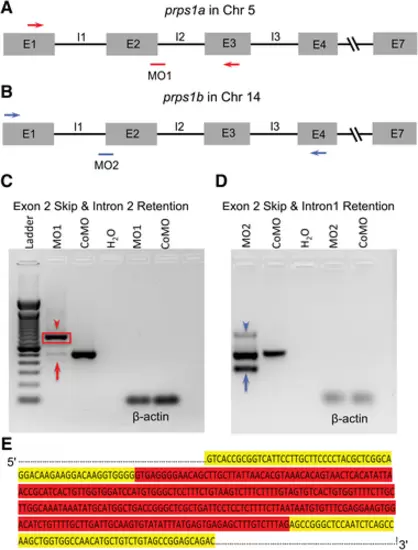
Efficacy of antisense morpholino knockdown of prps1a and prps1b in zebrafish. (A) Schematic drawing of genomic structure of the prps1a gene in chromosome 5 with PCR primers (red arrows) and morpholino 1 (MO1, red bar) targeting the junction between exon 2 (E2) and intron 2 (I2). (B) Schematic drawing of genomic structure of the prps1b gene in chromosome 14 with PCR primers (blue arrows) and morpholino 2 (MO2, blue bar) targeting the junction between intron 1 and exon 2. (C) DNA gel of RT-PCR products for MO1 morphants shows multiple bands between the red arrowhead and the red arrow compared with one band for control MO (CoMO) zebrafish. (D) DNA gel of RT-PCR products for MO2 morphants also shows multiple bands between the blue arrowhead and the blue arrow compared with one band for CoMO zebrafish. H2O: negative control, and ß-actin: positive control. (E) A portion of the sequence of the DNA gel enclosed by the red box in C for MO1 morphants, showing the full length of I2 retention (highlighted in red) for MO1 morphants. Sixty DNA bases of E2 upstream I2 and 60 bases of E3 downstream I2 of prps1a are highlighted in yellow. |
|
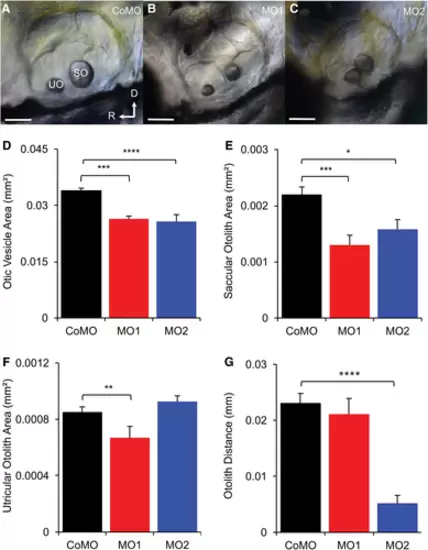
Phenotypes of MO1 and MO2 morphants compared with CoMO fish. (A, B, C) Lateral views of otic vesicles of CoMO, MO1, and MO2 fish at 3 dpf, showing abnormal morphology of otic vesicles of MO1 and MO2 morphants. SO, saccular otolith; UO, utricular otolith; D, dorsal; and R, rostral. Scale bars = 50 μm. (D) Comparison of otic vesicle areas among MO1, MO2, and CoMO fish, showing significantly smaller otic vesicles for both MO1 and MO2 morphants than CoMO fish. (E) Comparison of saccular otolith areas among CoMO, MO1, and MO2 morphants, showing significantly smaller SO for MO1 and MO2 than CoMO morphants. (F) Comparison of utricular otolith areas among CoMO, MO1, and MO2 morphants, showing smaller UO areas for MO1 than CoMO morphants but no size difference between MO2 and CoMO fish. (G) Comparison of otolith distances among MO1, MO2, and CoMO fish, showing shortened otolith distance for MO2 but normal otolith distance for MO1 morphants. In D–G, Values are presented as means + SEM; NCoMO = NMO1 = NMO2 = 10, *P < 0.05, ANOVA, and post hoc Tukey tests, **P < 0.01, ***P < 0.005, ****P < 0.001. EXPRESSION / LABELING:
PHENOTYPE:
|
|
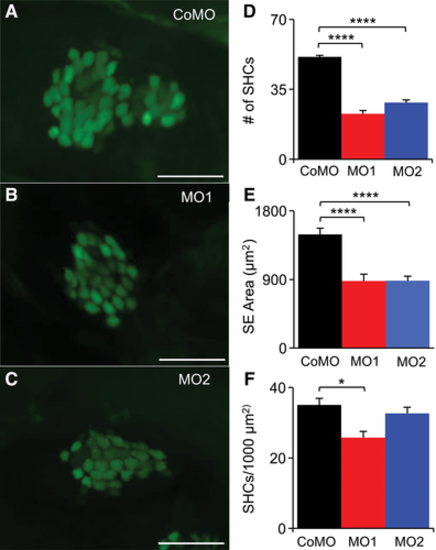
Reduction in the number of inner ear hair cells in MO1 and MO2 morphants. (A, B, C) Examples of saccular epithelia of CoMO, MO1, and MO2 Et(krt4: GFP) sqet4 fish at 3 dpf. Green areas in SE are GFP-labeled hair cell bodies. Scale bar = 25 μm. (D) Comparison in the number of saccular hair cells among CoMO, MO1, and MO2 fish, showing that MO1 and MO2 morphants have significantly fewer saccular hair cells than CoMO fish. (E) Comparison in saccular epithelium (SE) area among CoMO, MO1, and MO2 fish, showing that MO1 and MO2 morphants have significantly smaller saccular epithelia than CoMO fish. (F) Comparison of saccular hair cell density among CoMO, MO1, and MO2 fish, showing lower hair cell density in MO1 morphants but not for MO2 morphants. In D–F, values are presented as means + SEM; NCoMO = NMO2 = 8, NMO2 = 9, ANOVA, and post hoc Tukey tests, *P < 0.05, ****P < 0.001. PHENOTYPE:
|
|
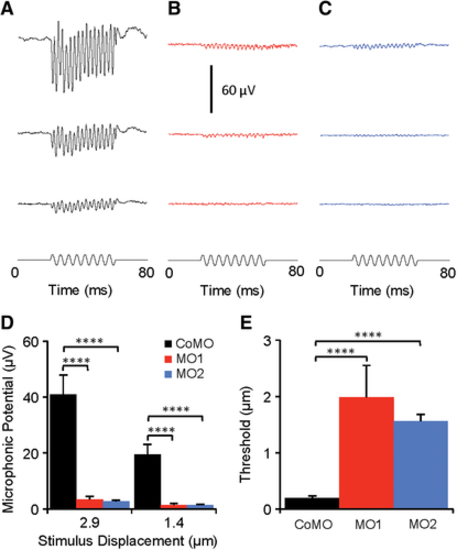
Hearing loss in MO1 and MO2 morphants. (A, B, C) Examples of microphonic response waveforms from CoMO, MO1, and MO2 morphants at 3 dpf in response to 200-Hz vibrating stimuli at three stimulus displacement levels (2.9, 1.4, and 0.7 μm from top to bottom). (D) Comparisons of microphonic amplitude at two stimulus displacements (2.9 and 1.4 μm) among CoMO, MO1, and MO2 fish, showing significant reductions in microphonic amplitude for both MO1 and MO2 morphants compared with CoMO fish. The microphonic waveforms were measured in root mean square and averaged 200 times. (E) Comparison of microphonic threshold among CoMO, MO1, and MO2 morphants, showing significant increases in microphonic threshold for MO1 and MO2 morphants. In D–E, data are presented as means + SEM; NCoMO = 10, NMO1 = 8, NMO2 = 9, ANOVA, and post hoc Tukey tests, ****P < 0.001. PHENOTYPE:
|

