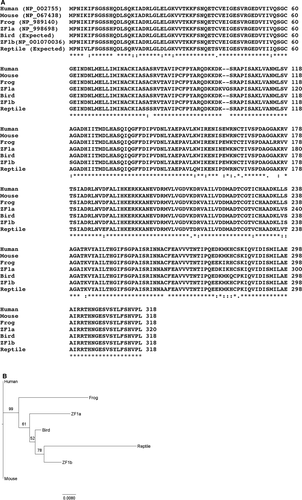
Fig. 1 (A) Comparison of amino acid sequences of phosphoribosylpyrophosphate synthetase 1 of vertebrate groups. Bird: Taeniopygia guttata, reptile: Anole carolinensis, frog: Xenopus tropicalis, and ZF: Danio rerio. “*”: amino acids are identical, “:”: amino acids are different but the function is conserved, “.”: amino acids are different but the function is semiconserved, and space: amino acids are different and there is no conservation of function. The sequence alignment was conducted using ClustalW2.1 online software (Larkin et al., 2007). (B) Phylogram of sequences of phosphoribosylpyrophosphate synthetase 1 of vertebrate groups shown in A. The phylogram was constructed with the (Randomized Axelerated Maximum Likelihood, RAxML) program using the “protgammalg” model (Stamatakis, 2014). Bootstrap support values are depicted on the tree. The scale bar indicates the number of amino acid substitutions per site.
Image
Figure Caption
Acknowledgments
This image is the copyrighted work of the attributed author or publisher, and
ZFIN has permission only to display this image to its users.
Additional permissions should be obtained from the applicable author or publisher of the image.
Full text @ Anat. Rec. (Hoboken)

