
- Title
-
Imaging neural events in zebrafish larvae with linear structured illumination light sheet fluorescence microscopy
- Authors
- Liu, Y., Dale, S., Ball, R., VanLeuven, A.J., Sornborger, A., Lauderdale, J.D., Kner, P.
- Source
- Full text @ Neurophotonics

Maximum intensity projections of 7-day-old elavl3:GCaMP5g; gad1b:RFP; mitfaw2/w2 zebrafish larva. (a)–(d) WF, RMS-SI, LR-SI, and LR-SI-non reconstructed images of the red channel of zebrafish larva’s central nervous system, respectively. WF and RMS images are scaled up 2× bicubicly to match the pixel count of the LR-SI method. The image size is 500×500 μm2 and scale bar shown in (a) is 75 μm. (e)–(h) 183.4×183.4 μm2 cutouts from (a)–(d) and the scale bar shown in (e) is 25 μm. The yellow line indicates the position of the cross-sections in Fig. 6.
|

Maximum intensity projection of 7-day old elavl3:GCaMP5g; gad1b:RFP; mitfaw2/w2 zebrafish larva treated with 15-mM PTZ at three different time points. 195 μm×195 μm cutouts from 199.7×399.4 μm2 images are shown. The scale bar is 30 μm, and the images are acquired with an illumination pattern of 9.36 μm at a speed of ∼48 raw fps, corresponding to seven reconstructed two-color fps. The interval between each time point is 0.5 s (Video Collage 1, MPEG4, 5.58 MB [URL: https://doi.org/10.1117/1.NPh.6.1.015009.1]).
|

LR-SI image of a 7-day-old elavl3:GCaMP5g; gad1b:RFP; mitfaw2/w2 zebrafish larva treated with 15 mM PTZ. (a) Integration of the intensity at the location of the RoI is calculated. (b) Intensity change of the RoI noted in (a) plotted as a function of time. LR-SI-non shows higher peak signals relative to the background compared to LR-SI. However, the LR-SI-non results in lower SNRs relative to LR-SI method. The scale bar is 40 μm.
|
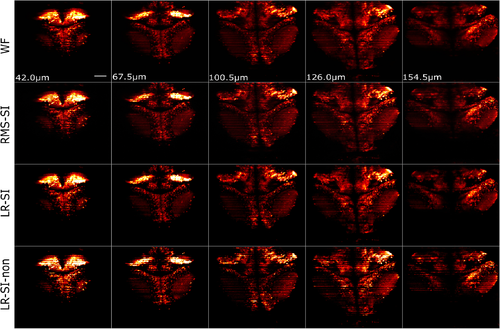
Slices from a 3-D image stack of a 7-day-old elavl3:GCaMP5g; gad1b:RFP; mitfaw2/w2 zebrafish larva with DSLM-SI. From the top to bottom row: WF, RMS-SI, LR-SI, and LR-SI-non. Each column is a different depth into the sample. image size is 399.36 μm×399.36 μm and the scale bar is 50 μm.
|

Comparison of optical sectioning performance. x−z planes from 3-D stack shown in Fig. 9: (a) WF, (b) RMS-SI, (c) LR-SI, and (d) LR-SI-non. Scale bar in (a) is 25 μm and image size is 252 μm×210 μm.
|