
Image
|
Figure Caption
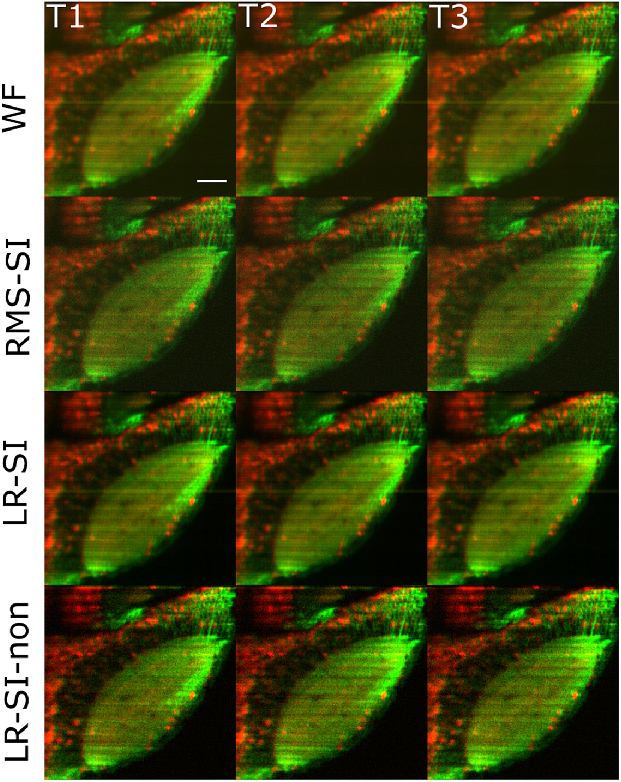
Fig. 7
Maximum intensity projection of 7-day old elavl3:GCaMP5g; gad1b:RFP; mitfaw2/w2 zebrafish larva treated with 15-mM PTZ at three different time points. 195 μm×195 μm cutouts from 199.7×399.4 μm2 images are shown. The scale bar is 30 μm, and the images are acquired with an illumination pattern of 9.36 μm at a speed of ∼48 raw fps, corresponding to seven reconstructed two-color fps. The interval between each time point is 0.5 s (Video Collage 1, MPEG4, 5.58 MB [URL: https://doi.org/10.1117/1.NPh.6.1.015009.1]).
Acknowledgments
This image is the copyrighted work of the attributed author or publisher, and
ZFIN has permission only to display this image to its users.
Additional permissions should be obtained from the applicable author or publisher of the image.
Full text @ Neurophotonics