- Title
-
Modelling pancreatic β-cell inflammation in zebrafish identifies the natural product wedelolactone for human islet protection
- Authors
- Delgadillo-Silva, L.F., Tsakmaki, A., Akhtar, N., Franklin, Z.J., Konantz, J., Bewick, G.A., Ninov, N.
- Source
- Full text @ Dis. Model. Mech.
|
EXPRESSION / LABELING:
PHENOTYPE:
|
|
Time-lapse imaging reveals dynamic interactions between β-cells and macrophages under chronic inflammation. (A) Representative snapshots from time-lapse movies from control and Tg(ins:il1b) larvae. Tg(ins:mCherry) labels the β-cells (red), whereas Tg(mpeg1:GAL4);Tg(UAS-Kaede) labels the macrophages (green). β-cells and macrophages were imaged every 5 min for 10 h starting at 4.5 dpf. The elapsed time in hours (hrs) is indicated. (B) Plot showing the time that individual macrophages spend in the islet region as defined using a region of interest (ROI) (n=5 animals each for il1b− and il1b+). In controls (blue), the macrophages rarely visit the islet. In Tg(ins:il1b) larvae (red), the macrophages show an increase in the time they spend in the islet region. Unpaired two-tailed t-test with Welch's correction, ****P<0.0001, mean±s.d. |
|
β-cell inflammation leads to reduced glucose responsiveness of β-cells and hyperglycemia following a glucose challenge. (A) Snapshots from live imaging of 4.5 dpf larvae expressing GCaMP6s and nuclear mCherry in the β-cells. The images show the GCaMP6s fluorescence before, during and after glucose stimulation. The larvae were mounted and imaged using a confocal microscope. The β-cells were stimulated with 12.5 mM glucose solution by intracardiac injection. (B) Traces of GCaMP6s fluorescence intensity over time for the islets shown in A. The islet of the WT larva showed a strong and coordinated increase in GCaMP6s fluorescence in response to glucose injection, indicating glucose-stimulated calcium influx, whereas the islet of the Tg(ins:il1b) larva did not respond to glucose. (C) Graph showing the GCaMP6s fluorescence-intensity fold change before and after the glucose injection. Tg(ins:il1b) β-cells showed a drastically reduced glucose-stimulated calcium influx compared to controls. Unpaired two-tailed t-test with Welch's correction, *P<0.05. n=5 larvae, mean±s.d. (D) A model showing the design of a glucose challenge in zebrafish larvae. The glucose challenge consists of incubating the larvae in three solutions: fish water (E3), 130 mM mannitol as an osmotic control, and 130 mM glucose. The larvae were incubated at 3 dpf and the glucose was measured at 5 dpf. (E) Plot showing glucose concentration following a glucose challenge in controls and Tg(ins:il1b) larvae. The Tg(ins:il1b) larvae show similar free glucose levels as WT larvae in fish water (E3) and mannitol. Following glucose challenge, the Tg(ins:il1b) larvae show an approximately 3.5-fold increase in free glucose compared to WT siblings. Two-way ANOVA with Sidak's multiple-comparison test; ****P<0.0001; each data point represents a pool of ten larvae; mean±s.d. |
|
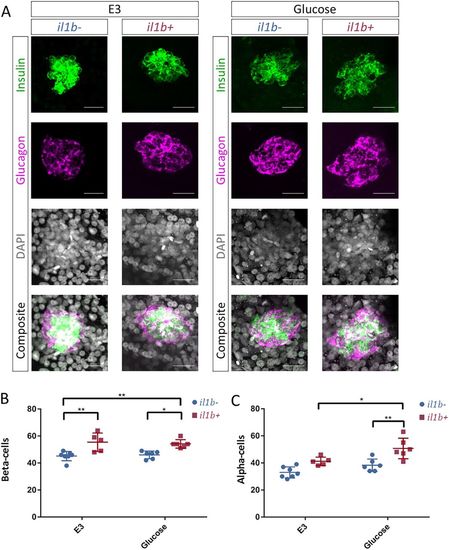
Chronic inflammation and high-glucose exposure leads to α-cell expansion. (A) Confocal images (maximum projections) of islets from WT and Tg(ins:il1b) larvae at 5 dpf following incubation in either E3 or 130 mM glucose from 3 to 5 dpf. Immunostainings against insulin (green) and glucagon (magenta) mark the β-cells and the α-cells, respectively. (B) Quantification of the number of β-cells in WT and Tg(ins:il1b) larvae. Tg(ins:il1b) larvae exhibit an increase in β-cells in both E3 and glucose. Two-way ANOVA with Sidak's multiple-comparison test; *P≤0.05, **P≤0.01. Mean±s.d. (C) Quantification of the number of α-cells in WT and Tg(ins:il1b) larvae. The number of α-cells did not differ significantly (P<0.5) between WT and Tg(ins:il1b) in E3. However, there were significantly more α-cells in Tg(ins:il1b) larvae compared to WT in the glucose-treated group. Two-way ANOVA with Sidak's multiple-comparison test; *P≤0.05, **P≤0.01. Scale bars: 20 μm. PHENOTYPE:
|
|
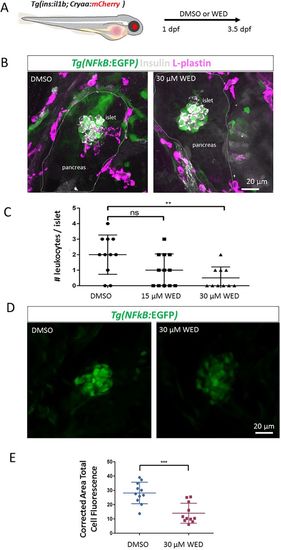
Wedelolactone treatment ameliorates immune-cell infiltration and reduces islet NF-κB signalling activation.(A) Schematic of the experimental approach. Tg(ins:il1b);Tg(NF-kB:GFP) embryos were treated with DMSO or wedelolactone (WED) from 1 to 3.5 dpf. At 3.5 dpf, the presence of L-plastin-positive leukocytes in the islet region was quantified. (B) Representative confocal images of Tg(ins:il1b);Tg(NF-kB:GFP) embryos treated with DMSO or 30 μM wedelolactone. Whereas the leukocytes have infiltrated the islet in DMSO controls, there is a reduction in islet-associated immune cells following wedelolactone treatment. (C) Quantification of the number of L-plastin-expressing cells in the islets of DMSO- and wedelolactone-treated larvae. One-way ANOVA with Sidak's multiple-comparison test; **P≤0.01; ns, not significant. Mean±s.d. (D) Representative confocal images of the islets of Tg(ins:il1b);Tg(NF-kB:GFP) embryos treated with DMSO or wedelolactone from 1 to 4 dpf. Wedelolactone-treated larvae show a visible reduction in NF-kB:GFP fluorescence intensity in the islet region at 4 dpf. (E) Quantification of corrected area total cell NF-kB:GFP fluorescence in the islet region following DMSO or wedelolactone treatment, showing a reduction in NF-kB:GFP fluorescence. Unpaired two-tailed t-test with Welch's correction, ***P≤0.05. Mean±s.d. EXPRESSION / LABELING:
PHENOTYPE:
|

ZFIN is incorporating published figure images and captions as part of an ongoing project. Figures from some publications have not yet been curated, or are not available for display because of copyright restrictions. PHENOTYPE:
|
|
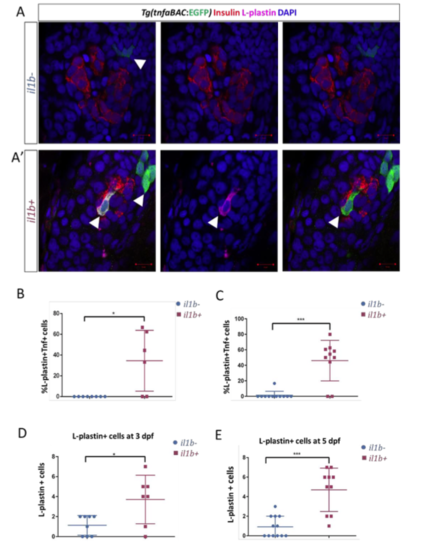
Leukocytes express tnfa in Tg(ins:il1b) larvae. (A-A’) Confocal slices (single plane) showing the primary islets of 3 dpf WT (A) and Tg(ins:il1b) larvae (A’) in the background of a Tg(tnfa:GFP) transcriptional reporter. The arrow in A’ shows an L-plastin-positive cell (magenta), which is also positive for tnfa:GFP (green). This cell is embedded in the islet. Some GFP-positive cells can be observed in the region corresponding to the extra-pancreatic duct in both WT and Tg(ins:il1b) larvae. These cells are L-plastin-negative. (B-C) Quantification of the proportion of GFP-positive cells among the L-plastin-positive cells in contact with the islet at 3 (B), unpaired two-tailed t-test with Welch’s correction, *p-value ≤ 0.05, mean±SD and 5 dpf (C), unpaired two-tailed t-test with Welch’s sorrection, ***p-value ≤ 0.001, mean±SD. (D-E) Quantification of the total number of L-plastin cells in contact with the islet at 3 (D), unpaired two-tailed t-test with Welch’s correction, *p-value ≤ 0.05, mean±SD and 5 dpf (E), unpaired two-tailed t-test with Welch’s correction, ***p-value ≤ 0.001, mean±SD . Scale bars in A-A’= 10 μm. |
|
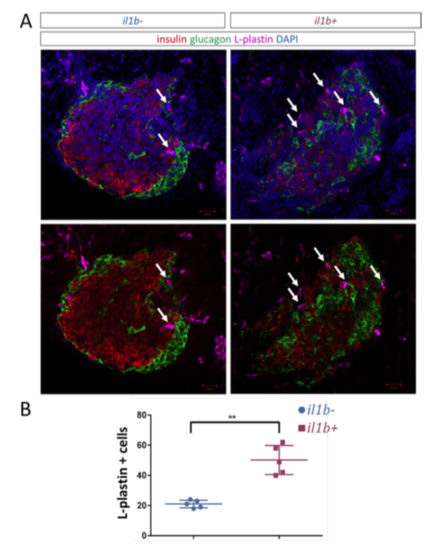
Persistent increase in immune cells within the islets of Tg(ins:il1b) fish at 30 dpf. (A) Confocal slices (single plane) showing the primary islets in 30 dpf WT and Tg(ins:il1b) juveniles. Arrows point to L-plastin-positive cells. (B) Quantification of the number of L-plastin-positive cells per islet. Tg(ins:il1b) animals exhibit an increase in L-plastin-positive cells. Unpaired two-tailed t-test with Welch’s correction. **p-value ≤ 0.01, mean±SD. Scale bars = 20 μm. PHENOTYPE:
|

ZFIN is incorporating published figure images and captions as part of an ongoing project. Figures from some publications have not yet been curated, or are not available for display because of copyright restrictions. |
|
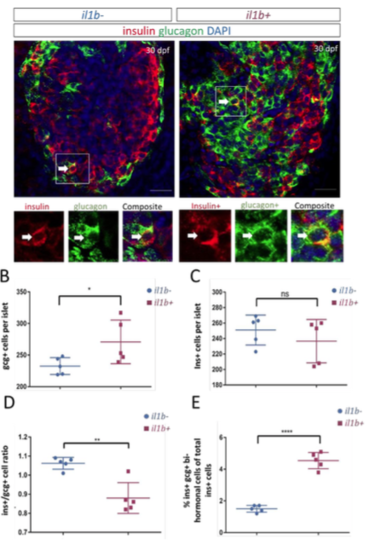
Tg(ins:il1b) juveniles exhibit an increase in alpha-cells and higher proportion of insulin-positive cells that co-express glucagon. (A) Confocal slices (single plane) showing the primary islets in 30 dpf WT and Tg(ins:il1b) juveniles. The higher-magnification insets show insulin/glucagon double-positive cells corresponding to the outlined region in the top panels (arrows). (B) Quantification of the number of glucagon-positive cells per islet. Tg(ins:il1b) animals exhibit an increase in glucagon-positive cells. Unpaired two-tailed t-test with Welch’s correction; *p-value ≤ 0.05, mean±SD. (C) Quantification of the number of insulin-positive cells per islet. Unpaired two-tailed t-test with Welch’s correction, ns: not significant. mean±SD. (D) Quantification of the ratio of insulin-to-glucagon-positive cells per islet. Unpaired two-tailed t-test with Welch’s correction; **p-value ≤ 0.01, mean±SD. (E) Quantification of portion of insulin positive cells per that co-express glucagon over the total number of insulin-positive cells per islet. Unpaired two-tailed t-test with Welch’s correction; ****p-value ≤ 0.0001, mean±SD. Scale barsin A = 20 μm. PHENOTYPE:
|


