
|
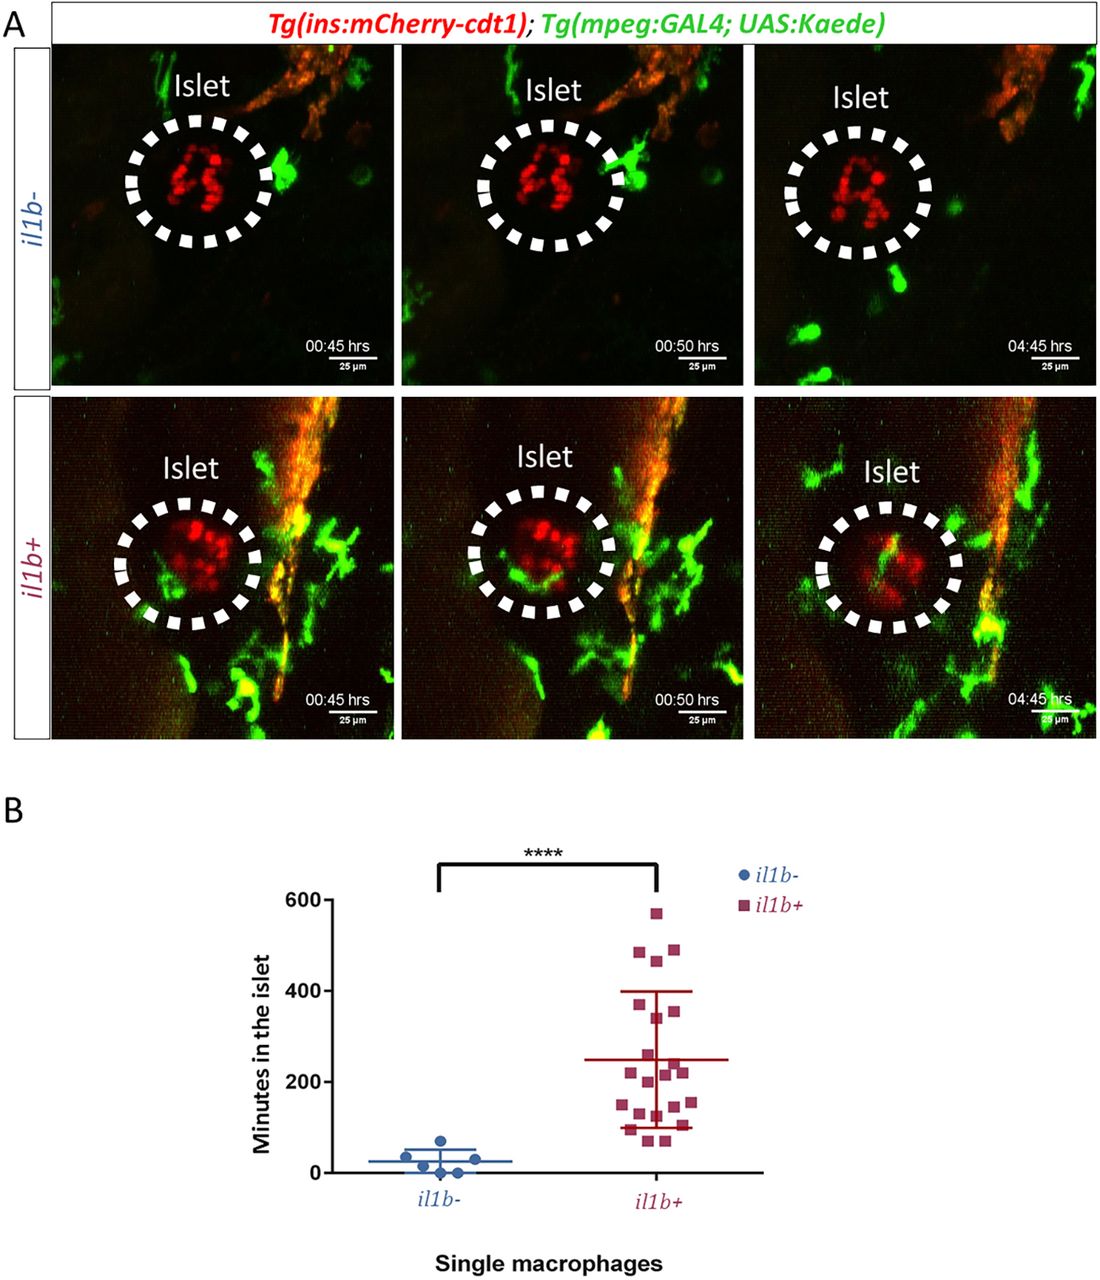
Fig. 2
Time-lapse imaging reveals dynamic interactions between β-cells and macrophages under chronic inflammation. (A) Representative snapshots from time-lapse movies from control and Tg(ins:il1b) larvae. Tg(ins:mCherry) labels the β-cells (red), whereas Tg(mpeg1:GAL4);Tg(UAS-Kaede) labels the macrophages (green). β-cells and macrophages were imaged every 5 min for 10 h starting at 4.5 dpf. The elapsed time in hours (hrs) is indicated. (B) Plot showing the time that individual macrophages spend in the islet region as defined using a region of interest (ROI) (n=5 animals each for il1b− and il1b+). In controls (blue), the macrophages rarely visit the islet. In Tg(ins:il1b) larvae (red), the macrophages show an increase in the time they spend in the islet region. Unpaired two-tailed t-test with Welch's correction, ****P<0.0001, mean±s.d.