- Title
-
A Cyfip2-Dependent Excitatory Interneuron Pathway Establishes the Innate Startle Threshold
- Authors
- Marsden, K.C., Jain, R.A., Wolman, M.A., Echeverry, F.A., Nelson, J.C., Hayer, K.E., Miltenberg, B., Pereda, A.E., Granato, M.
- Source
- Full text @ Cell Rep.
|
The Startle Threshold Is Reduced in Mutants from the Forward Genetic Screen (A) Distribution of startle response frequency to 10 low-intensity (13.5 dB) stimuli in 5 dpf wild-type TLF larvae (black bars, n = 110) and larvae from a cross of triggerhappyp400 carriers (red bars, n = 104). (B) Startle frequency for 10 trials at each of 6 intensities with sigmoidal fit curves. triggerhappyp400 and TLF larvae were split into two groups: putative mutants (top 25%; p400, red line; TLF, black line) and putative siblings (bottom 75%; p400, pink line; TLF, gray line) based on their startle response frequency at 13.5 dB (mean ± SEM). (C) Startle sensitivity indices. The area under the curves in (B) are displayed for the top 25% of WIK and TLF (black circles and squares, mean ± SD) and 7 mutant lines (red triangles; p400-406; ∗∗∗∗p < 0.0001, one-way ANOVA with Dunnett’s multiple comparison test). PHENOTYPE:
|
|
Hypersensitivity of triggerhappyp400 Mutants Caused by cyfip2 Mutations and Rescued by Conditional Cyfip2-GFP Expression (A) Acoustic startle circuit. Acoustic nerve (VIII), posterior lateral line nerve (PLL), feedforward (FF) inhibitory, and excitatory spiral fiber (SF) neurons connect to the Mauthner cells (red). (B) Cyfip2 protein interaction domains (Abekhoukh and Bardoni, 2014, Pittman et al., 2010). triggerhappyp400(cyfip2p400) mutants have a premature stop codon after 342 of 1,253 amino acids. The previously identified nevermind (cyfip2tr230b) mutation (Pittman et al., 2010) is shown. (C) Startle sensitivity curves of siblings and trans-heterozygous (trans-het) larvae from cyfip2p400/+ X cyfip2tr230b/+ crosses (n = 75 siblings, 34 trans-hets; mean ± SEM). (D) Startle sensitivity index in cyfip2p400 sibling and mutant larvae expressing Tg(hsp70:cyfip2-GFP). Larvae were given no heat shock or one 40-min heat shock at 30 hpf. Cyfip2-GFP fluorescence was largely restricted to the CNS and was visible 90 min after heat shock, peaked around 3 hr after heat shock, and was detectable at low levels 24 hr later (Figure S3C). Without a heat shock, cyfip2p400 mutants had increased startle sensitivity (∗∗∗p < 0.001, Mann-Whitney test), whereas heat shock reduced the sensitivity of cyfip2 mutants with the transgene compared with those without it (∗∗p < 0.01, Mann-Whitney test). (E) Startle sensitivity curves for fmr1 sibling (n = 62) and mutant larvae (fmr1hu2787/hu2787, n = 20) at 5 dpf (mean ± SEM). (F) Hindbrain expression of Cyfip2 in 5 dpf wild-type (cyfip2+/+) and mutant (cyfip2p400/p400) larvae using a Cyfip2 antibody (Ab). Membranes of VIII neurons are marked by Tg(SCP1:Gal4FF(y256Et));Tg(UAS:gap43-citrine) and anti-GFP Ab. Dashed lines indicate the otic vesicles (OVs). Scale bar, 10 μm. |
|
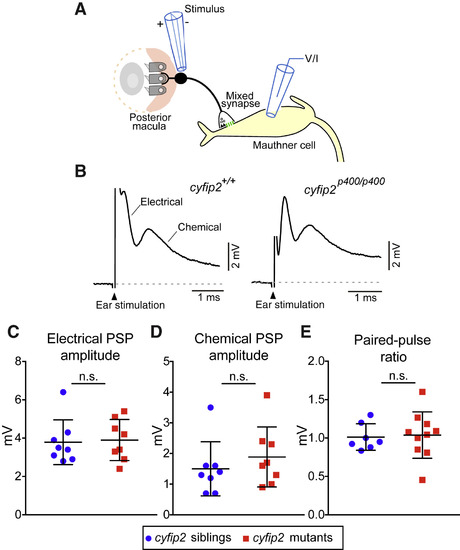
VIII Nerve Excitatory Inputs to the Mauthner Cell Are Normal in cyfip2 Mutants (A) Diagram of the stimulating electrode (stimulus) adjacent to the OV posterior macula, the club-ending mixed synapse between VIII afferents and the M-cell, and the recording electrode (voltage/current [V/I]) on the M-cell. (B) Representative traces of M-cell synaptic responses after stimulation of VIII afferents in cyfip2+/+ (left) and cyfip2p400/p400 (right) larvae at 5 dpf. The stimulation artifact has been truncated for clarity, and the electrical and chemical components are indicated. (C and D) Mean amplitude of M-cell electrical (C) and chemical synaptic responses (D) ± SD (n = 8 siblings, 8 mutants; p = 0.78, 0.29, Mann-Whitney test). (E) Paired-pulse ratios were unaltered in cyfip2p400/p400 larvae (p = 0.76, Mann-Whitney test). |
|
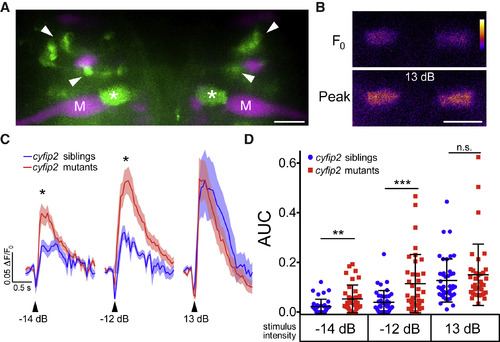
SF Axon Terminal Activity Is Increased in cyfip2 Mutants (A) Maximum intensity projection of Tg(−6.7FRhcrtR:gal4VP16); Tg(UAS:GCaMP5), showing labeled SF neurons (green). M-cells (M) and other reticulospinal neurons were labeled with rhodamine dextran (magenta). Arrowheads indicate SF cell bodies, and asterisks mark SF axon terminals in the M-cell axon cap. Scale bar, 10 μm. (B) Representative pseudocolored images of baseline (F0) and peak fluorescence in SF axon terminals following a strong acoustic stimulus (13 dB; the color scale denotes fluorescence intensity; black, lowest; white, highest). Scale bar, 10 μm. (C) Averaged traces of SF terminal Ca2+ responses following low (−14 dB), medium (−12 dB), and strong (13 dB) acoustic stimuli (n = 42 responses from 10 siblings, blue line; n = 36 responses from 9 mutants, red line; mean ± SEM; ∗p < 0.05, Mann-Whitney test). (D) Scatterplot of the area under the curve for individual SF axon terminal Ca2+ responses (mean ± SD; ∗∗p = 0.0049, ∗∗∗p = 0.0003, Mann-Whitney test). |
|
SF Neurons Are Hyperexcited by Weak Acoustic Stimuli in cyfip2 Mutants and Reversal of the Hypersensitivity Phenotype (A) Representative SF neuron Ca2+ responses in cyfip2 siblings and mutants 1 s before (F0) and 150 ms after (peak) medium-intensity (−12 dB) acoustic stimulation. Dashed circles indicate SF cell bodies, arrowheads mark cells that fired according to our criteria (see text). Scale bar, 10 μm. (B) Distribution of SF neuron firing probability (n = 48 cells from 8 siblings, 36 cells from 6 mutants; ∗∗∗∗p < 0.0001, Mann-Whitney test). (C) Startle sensitivity index of cyfip2p400 siblings and mutants expressing Tg(hsp70:cyfip2-GFP) 4 dpf before 8 heat shock cycles at 37°C separated by 120 min (d4 pre; ∗p = 0.025, unpaired t test). The same larvae were tested for startle sensitivity after heat shock at 6 dpf (d6 post; ∗∗p = 0.0018, paired t test). cyfip2p400 mutants without the hsp70:cyfip2-GFP transgene remained hypersensitive (p = 0.46, paired t test). (D) Model of Cyfip2’s role in the startle circuit. In cyfip2 mutants, activity is enhanced in the VIII-SF-M-cell pathway, either through a direct VIII-SF connection or through an indirect connection via an unknown cell population (question mark), leading to enhanced M-cell firing and startle behavior. In wild-type fish, Cyfip2 potentially acts at pre- and/or postsynaptic sites, indicated by asterisks, to dampen neural activity. |
|
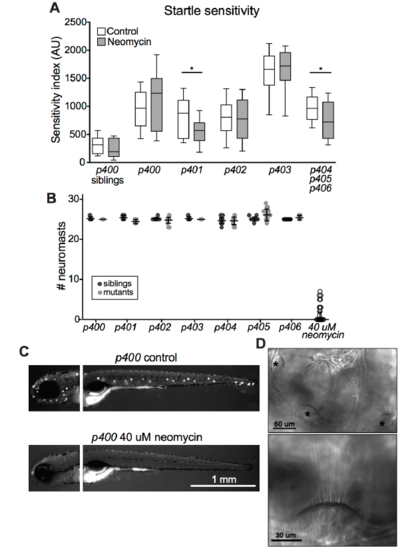
Otic vesicle and lateral line hair cell analysis, Related to Figure 1 (A) Boxplot showing startle sensitivity index after ablation of lateral line neuromasts with 40 μM neomycin. Sibling larvae are unaffected (n = 32 control, 27 neomycin), as are p400 (n=22 con, 16 neo), p402 (n=68 con, 68 neo), and p403 (n=10 con, 9 neo) mutants. p401 (n=22 con, 21 neo; *p=0.0320, Mann-Whitney) and p404-6 (n=23 con, 40 neo; *p=0.0333, Mann-Whitney) mutants’ sensitivity is partially rescued by lateral line ablation. (B) Neuromast counts in siblings and mutants, based on DASPEI labeling. All larvae treated with 40 uM neomycin are grouped, with only a few individuals having intact neuromasts after treatment. (C) Images of DASPEI labeling of neuromasts in control and neomycintreated triggerhappyp400 mutants. (D) Top, representative DIC images of otic vesicle showing the positions of the anterior, medial, and posterior hair cell bundles (asterisks). Bottom, magnification showing intact hair cell stereocilia. All mutants and siblings displayed similar morphology. |
|
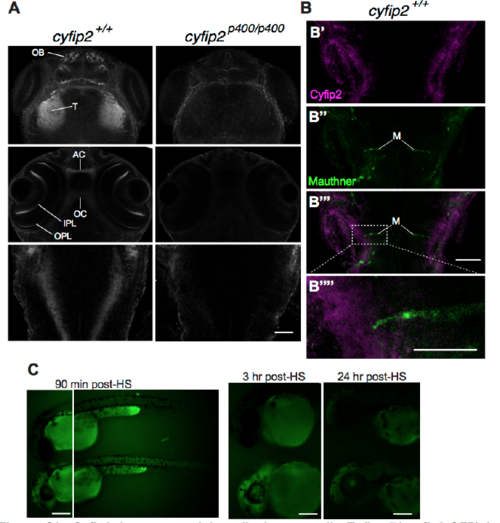
Cyfip2 is expressed broadly in neuropil; Tg(hsp70:cyfip2-GFP) is detectable in CNS for approximately 24 hours after heat shock, Related to Figure 2 (A) Cyfip2 Ab stain in cyfip2+/+ and cyfip2p400/p400 larvae at 72 hpf. OB: olfactory bulb, T: tectum, AC: anterior commissure, OC: optic chiasm, IPL: inner plexiform layer, OPL: outer plexiform layer (scale bar 30 μm). (B) Cyfip2 Ab stain (magenta) at 72 hpf showing labeling near the lateral dendrite of the Mauthner cell (M, green), labeled by Tg(GFFDMC130A);Tg(UAS:gap43-citrine) (scale bar: B’-B’’’: 30 μm; B’’’’: 15 μm). (C) Expression of Tg(hsp70:cyfip2-GFP) after a single 40 min heat shock at 37°C in larvae with (bottom) and without (top) the transgene. Scale bars 100 μm. EXPRESSION / LABELING:
PHENOTYPE:
|
|
Mauthner cell club endings are normal but dendrite morphology is altered in cyfip2 mutants, Related to Figure 3 (A) Images of Mcell gap junctions labeled by α-connexin 35 (Cx35) Ab (scale bar: 10 μm). Asterisks mark blood cells, dashed boxes highlight magnified region of lateral dendrite with club endings shown in (A’) and (A”) (scale bars: 5 μm). (B) Number of club endings (n=7 siblings, 8 mutants; p=0.11, Mann-Whitney; mean ± SD). (C) Confocal stacks of gap43-citrine-labeled Mcell membranes were masked and rendered in 3D using Imaris. Representative images show severely altered dendritic morphology in cyfip2 mutants (scale bar: 5 μm). (D-E) Quantification of soma, lateral dendrite, and ventral dendrite volume (***p<0.001, ****p<0.0001; Mann-Whitney; mean ± SD). |
|
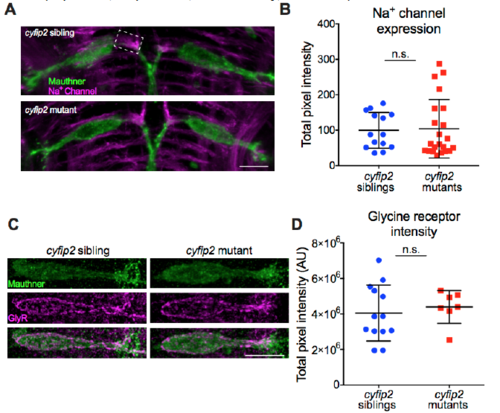
Sodium channel and Glycine receptor expression on the Mauthner cell is normal in cyfip2 mutants, Related to Figure 3 (A) Representative images of maximum intensity projections of confocal stacks showing Mcell membranes (green), labeled by Tg(GFFDMC130a);Tg(UAS:gap43-citrine) and α- GFP Ab and sodium channels (Na+ channel, magenta), labeled by a pan-Na+ channel Ab (scale bar: 10 μm). Dashed box indicates the area of the Mcell axon cap that was analyzed in (B). (B) Quantification of Na+ channel expression in the Mcell axon cap (n=14 siblings, 22 mutants; p=0.62, Mann-Whitney; mean ± SD). (C) Representative examples of cyfip2 sibling and mutant Mcell glycine receptor (GlyR) expression. GlyR were labeled with an α-GlyR Ab (magenta) (scale bar: 10 μm). (D) Total intensity of GlyR staining on the Mcell was unchanged in cyfip2 mutants (n=13 sibling larvae, 7 mutant larvae; p=0.59, Mann-Whitney; mean ± SD). |
|
Startle sensitivity and Mauthner firing is increased in cyfip2 mutants during in vivo Ca2+ imaging, Related to Figures 4 and 5 (A) Startle frequency in cyfip2 siblings and mutants during head-restrained Ca2+ imaging following low (-14 dB), medium (-12 dB), and high (13 dB) intensity acoustic stimuli (**p<0.01, ***p<0.001, Mann-Whitney; mean ± SD). (B) Representative examples of Cx35 labeling of the Mcell axon initial segment (AIS). Dashed box indicates area analyzed in (C) (scale bar: 10 μm). (C) Quantification of Cx35 staining on Mcell AIS (n=14 siblings, 12 mutants; p=0.67; mean ± SD). (D) Mcell firing frequency in response to acoustic stimuli was measured by Ca2+ imaging in head-restrained 5 dpf larvae using Tg(Gal4FF- 62A);Tg(UAS:GCaMP6s) (n=11 siblings, 7 mutants; *p<0.05, Mann-Whitney; mean ± SD). (E) Total intensity of GlyR staining on Spiral Fiber Neurons (SFN) was unchanged in cyfip2 mutants (n=7 sibling larvae, 12 mutant larvae; p=0.13, Mann-Whitney; mean ± SD). |


