- Title
-
Spliceosomal components protect embryonic neurons from R-loop-mediated DNA damage and apoptosis
- Authors
- Sorrells, S., Nik, S., Casey, M., Cameron, R.C., Truong, H., Toruno, C., Gulfo, M., Lowe, A., Jette, C., Stewart, R.A., Bowman, T.V.
- Source
- Full text @ Dis. Model. Mech.
|
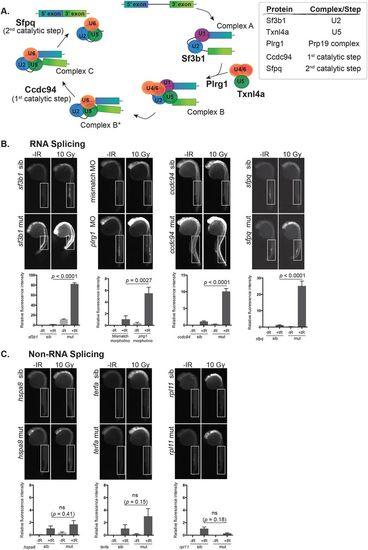
Disruption of RNA splicing factor genes sensitizes embryonic neurons to IR-induced apoptosis. (A) Schematic of the RNA splicing pathway showing the steps in which the RNA splicing factors used in this study are expected to function. (B) Splicing factor mutant and sibling embryos, or morphants and controls, were exposed (+IR) or left unexposed (-IR) to 10 Gy IR and analyzed 3 h later for active caspase-3. All embryos were irradiated at 24 hpf, except sf3b1hi3394aTg mutants and siblings which were irradiated at 22 hpf before the neurodegenerative phenotype became severe. Upper panels show representative images of active caspase-3 staining in each genotype or treatment group. Lower panels show the quantification of active caspase-3 staining for each genotype measured in the spinal cord area within the boxed regions. At least 10 embryos were quantified per genotype and treatment condition and fluorescence intensity from sibling +IR was normalized to one to account for non-specific background staining. (C) Non-splicing factor mutants and siblings were analyzed as in B. ns, not significant; error bars represent s.e.m. PHENOTYPE:
|

ZFIN is incorporating published figure images and captions as part of an ongoing project. Figures from some publications have not yet been curated, or are not available for display because of copyright restrictions. |
|
R-loop levels are increased in spliceosomal mutant zebrafish. (A) Immunofluorescence confocal images of nuclei (DAPI) and R-loops (S9.6) in cells isolated from 24 hpf sf3b1hi3394aTg mutants and their wild-type siblings. The lower panel is a merged image with an inset of a single cell to better show R-loop patterns. (B) Quantification of R-loop levels in A. Each dot represents R-loop levels for a single cell. P-value calculated by t-test with Welch's correction. (C,D) R-loop levels in rpl11hi3820bTg mutants were measured as in A and B. (E) Co-staining of R-loops with the pan-neuronal marker HuC/HuD in single cells isolated from 24 hpf sf3b1hi3394aTg mutants and their wild-type siblings. (F) Quantification of R-loop levels in HuC/HuD-positive and HuC/HuD-negative cells. (G) Co-staining of γH2AX and HuC/HuD. (H) Quantification of γH2AX fluorescence intensity in HuC/HuD-positive and HuC/HuD-negative cells. For all graphs, error bars represent the s.e.m. For images, 63× magnification with 6.5× zoom. Scale bar: 5 μm. For F and H, P-values were calculated by one-way ANOVA with Sidak's multi-testing correction. *P<0.05; **P<0.01; ***P<0.001; **** P<0.0001; n.s., not significant. Data represent normalized values across three replicates. |
|
RNASEH1 reverses R-loops, DNA DSBs and apoptosis in spliceosomal mutant zebrafish. (A) Schematic of the RNASEH1 overexpression experiment. (B) Quantification of R-loop levels in cells isolated from 24 hpf Tg(hsp70:M27RNASEH1-GFP)-negative and Tg(hsp70:M27RNASEH1-GFP)-positive sf3b1hi3394aTg mutant and wild-type siblings following heat shock induction. (C) Confocal images showing immunofluorescence of nuclei (DAPI) and DNA damage (γH2AX) in cells isolated from 24 hpf Tg(hsp70:M27RNASEH1-GFP)-negative and Tg(hsp70:M27RNASEH1-GFP)-positive sf3b1hi3394aTg mutant and wild-type siblings. The lower panel is a merged image with an inset of a single cell to better show γH2AX staining. (D) Quantification of γH2AX fluorescence intensity in sf3b1hi3394aTg mutant and wild-type siblings. (E) Representative flow cytometry plots showing active caspase-3 levels on the y-axis and forward scatter (FSC) on the x-axis. (F) Quantification of active caspase-3 levels in 24 hpf Tg(hsp70:M27RNASEH1-GFP)-negative and Tg(hsp70:M27RNASEH1-GFP)-positive sf3b1hi3394aTg mutant and wild-type siblings following heat shock induction. For images, 63× magnification with 6.5× zoom. Scale bars: 5 μm. Error bars represent s.e.m. P-values were calculated by one-way ANOVA with Sidak's multi-testing correction. *P<0.05; **P<0.01; ***P<0.001; **** P<0.0001; n.s., not significant. For D and F, data represent normalized values across three replicates. |
|
The rs25 mutation disrupts the txnl4a gene (A) rs25 siblings and mutants were exposed to 10 Gy IR and analyzed by bright field microscopy at 4.5 hpIR. Black arrows in the rs25 mutants mark the accumulation of cell death. (B-C) Wild type embryos and rs25 mutants were exposed to 10 Gy IR at 24 hpf, fixed at 3 hpIR, analyzed by active Caspase-3 and fluorescence was quantified. White arrowheads in the rs25 mutants mark the accumulation of active Caspase-3-marked apoptosis. (D) rs25 siblings and mutants were imaged by bright field microscopy at 3 and 5 dpf. Solid arrowheads in rs25 mutants mark accumulation of cell death in the head. Single, open arrowheads mark the curved tail, and double arrowheads mark heart edema. (E) The rs25 mutation was localized to linkage group 19 between flanking markers z26232 and z9059. (F) Sequencing of rs25 mutants revealed a thymine to adenine transition within the txnl4a coding sequence replacing the third amino acid (tyrosine) with a stop codon (Y3-Stop). Schematic of txnl4a shows 3 exons (in grey boxes), the 5’ and 3’ untranslated region (in black boxes), and introns (bent lines). Sequencing of the txnl4a gene is shown for wild type, rs25 mutant, and an rs25 heterozygote. A vertical blue line intersects the position of the mutated nucleotide. The solid, black lines under the sequencing designate the start of the coding sequence and rs25-mediated premature stop codon. (G) Embryos from an incross of rs25 heterozygotes were injected with control mRNA (GFP) or txnl4a mRNA. Embryos were exposed (or left unexposed) to 10 Gy at 24 hpf and analyzed 3 hours later for active Caspase-3. |
|
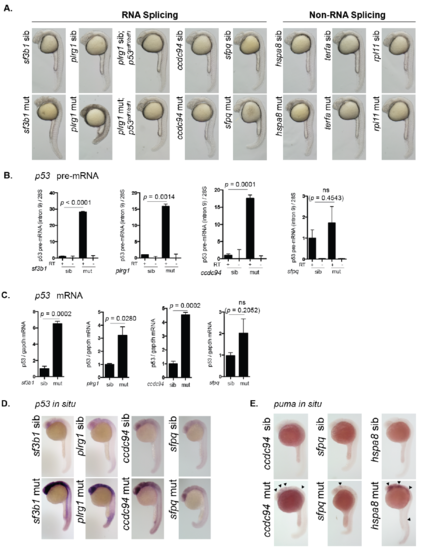
Splicing-factor mutants have elevated levels of tp53. (A) Sibling and mutant embryos from sf3b1hi3394aTg, plrg1hi3174aTg, plrg1hi3174aTg;p53zdf1/zdf1, ccdc94zd1000, sfpqhi1779Tg, hspa8hi138Tg, terfahi3678Tg, and rpl11hi3820bTg were imaged by bright-field microscopy at 25 hpf. Mutant phenotypes include neurodegeneration, curved tail, heart edema, and yolk extension defects. terfahi3678Tg and rpl11hi3820bTg mutants are indistinguishable from siblings at this time point. (B) Splicing factor mutants and siblings were separated by phenotype. RNA was harvested from each group at 30 hpf, DNAse treated, and reverse transcribed using random hexamer primers. Intron 9 of tp53 was analyzed by qPCR to determine levels of tp53 pre-mRNA. Minus reverse transcriptase (-RT) samples were included to control for genomic DNA contamination. tp53 pre-mRNA levels were normalized to 28S RNA levels to yield a relative amount of RNA expression between groups. (C) RNA collected from embryos described in (B) was reverse transcribed using oligo-dT primers and analyzed by qPCR for tp53 mRNA expression. gapdh mRNA levels were analyzed to determine relative amount of RNA expression per group. ns; not significantly different. (D) Splicing factor mutants and siblings were grown to 24 hpf and analyzed by whole mount in situ hybridization for tp53 mRNA expression. (E) Sibling and mutant embryos from ccdc94zd1000, sfpqhi1779Tg, and hspa8hi138Tg were grown to 24 hpf and analyzed by whole mount in situ hybridization for the mRNA expression of the Tp53-target gene puma. |
|
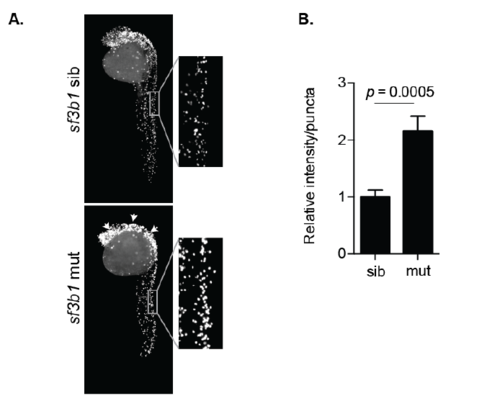
The splicing factor mutant sf3b1hi3394 have elevated levels of H3S10P. (A) Embryos were analyzed at 31 hpf by whole-mount immunofluorescence to detect histone H3 phosphorylation at serine 10 (H3S10P). Arrowheads mark increased H3S10P staining in the head of the sf3b1hi3394aTg mutants. Magnified representative images of neural tissue highlighting differences in staining. (B) Neural tissue from the tails of sf3b1hi3394aTgmutants and siblings was quantified for intensity of H3S10P staining and normalized to the average number of H3S10P positive puncta per sibling control. |


