- Title
-
Tcf7l2 plays pleiotropic roles in the control of glucose homeostasis, pancreas morphology, vascularization and regeneration
- Authors
- Facchinello, N., Tarifeño-Saldivia, E., Grisan, E., Schiavone, M., Peron, M., Mongera, A., Ek, O., Schmitner, N., Meyer, D., Peers, B., Tiso, N., Argenton, F.
- Source
- Full text @ Sci. Rep.

ZFIN is incorporating published figure images and captions as part of an ongoing project. Figures from some publications have not yet been curated, or are not available for display because of copyright restrictions. PHENOTYPE:
|
|
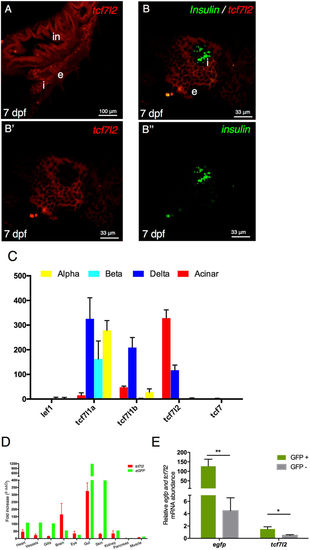
Canonical Wnt signalling and tcf7l2 expression in the pancreas. (A,B) Single and double fluorescent WISH comparing the expression of tcf7l2 and insulin at 7 dpf. Images show confocal single planes at 7 dpf at different magnification of (A) (20x) and (B,B’,B”) (60x). Merging the green and red channels identifies regions with distinct gene expression of the two genes (B’,B”). in: intestine, e: exocrine tissues, i: principal islet. Scale bar = 100 μm. (C) Expression level (count normalized by library size) obtained by RNAseq of different Tcf/Lef genes in α, β, δ and acinar cells from adult zebrafish. (D) tcf7l2 and egfp expression values from 10 different tissues derived from transgenic Tg(fli1a:EGFP)y1 adult fish. Brain (Br), Eye (Ey), Gills (Gi), Gut (Gu), Heart (He), Kidney (Ki), Muscle (Mu), Pancreas (Pa), Vessels (Ve). (E) Enrichment of GFP+ cells from Tg(fli1a:EGFP)y1 zebrafish embryos. Relative expression of indicated genes, in GFP+ (green bars) and GFP− (grey bars) cells, determined by quantitative RT-PCR. Relative expression levels were determined by normalization to arp. Values represent the mean ± SEM. Asterisk above column indicate statistical differences among groups. |
|
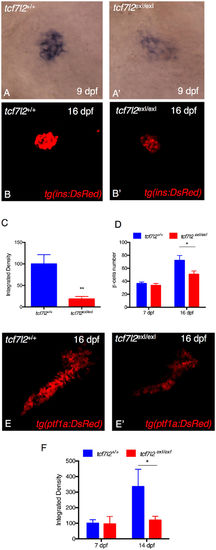
tcf7l2 is required for regulation of insulin expression and exocrine pancreas development. Analysis of insulin in control embryos (A) and in tcf7l2 exI/exI mutants (A’) by in situ hybridization. Lateral views of the pancreatic area are shown with the anterior side to the right. The expression of insulin is significantly reduced in the mutants. (B–B”) Analysis of pancreatic islet in tcf7l2 exI/exI mutant in Tg(ins:dsRed) background. 2D projections of confocal Z-series images of DsRed expression in living Tg(ins:DsRed) embryos at 16 dpf. (B) wt; (B’) homozygous mutant. (C) Graphic presentation of the integrated density of fluorescence in the red channel in tcf7l2 exI/exI mutant and wild-type sib controls in Tg(ins:dsRed) at 16 dpf. (D) Quantification of the number of β cells during juvenile growth of tcf7l2 exI/exI and control siblings. (E–E’) Analysis of exocrine pancreas in tcf7l2 exI/exI mutant in Tg(ptf1a:dsRed), (E) wt and (E’) mutant at 16 dpf. (F) Graphic presentation of the integrated density of fluorescence in the red channel in tcf7l2 exI/exI mutant and wild-type sib controls in Tg(ela3l:Crimson) at 7 and 14 dpf. Data were obtained from 6 individuals per genotype, repeated in 2 different experiments. All reference to phenotypes was confirmed by genotyping. The integrated density was obtained using the Fiji software. Values represent the mean ± SEM. Asterisk above column indicate statistical differences among groups *p < 0.05. EXPRESSION / LABELING:
PHENOTYPE:
|
|
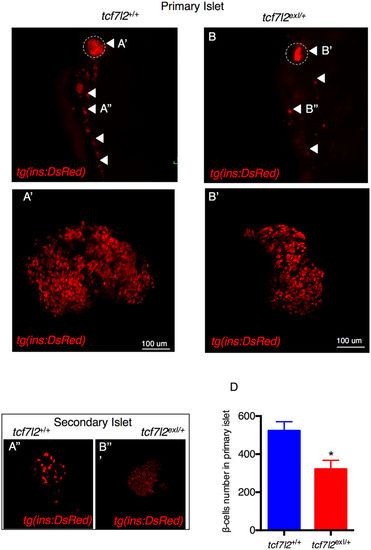
Morphology of β cells in wt and tcf7l2 exI/+ heterozygous adults. (A,B) Whole gut tissue extracted from 9 month-old wt and tcf7l2 exI/+ fish in Tg(ins:dsRed) background. Dashed circle: primary islet. Arrowheads: secondary islets and individual β cells extending caudally along the intestine. Examples of projection of a confocal stack image (A’,B’) of primary islets and secondary islet (A”,B”). (C) Quantification of β cells in 9 months old fish. Data were obtained from 3 individuals per genotype, repeated in 2 different experiments. |
|
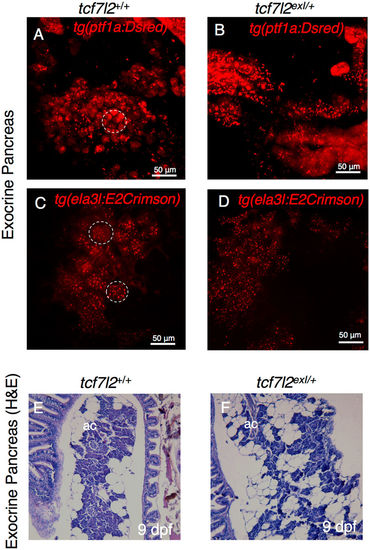
Morphology of exocrine pancreas in wt and tcf7l2 exI/+ heterozygous adults. (A,B) Projection of a confocal stack image of exocrine pancreas extracted from 9-month-old wt and tcf7l2 exI/+ fish in Tg(ptf1a:DsRed) background. (C,D) Projection of a confocal stack image of exocrine pancreas extracted from 6-month-old wt and tcf7l2 exI/+ fish in Tg(ela3l:Crimson) background. Dashed circles indicate typical acinar structures. Scale bar = 50 μm. (E,F) H&E staining of acinar cells (ac) of wt (E) and tcf7l2 exI/+ (F) at 9 mpf. |
|
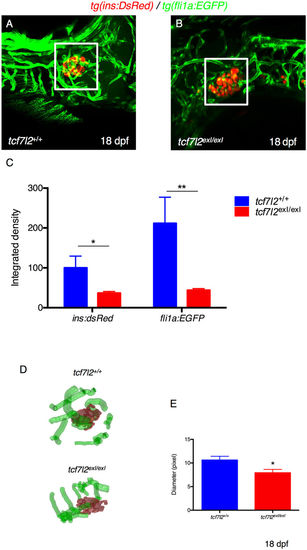
Defects in vascular endothelium and pancreas development of tcf7l2 exI/exI homozygous larvae. (A,B) Analysis of pancreatic islet and blood vessels inside and around the pancreas of tcf7l2 mutants and wild-type sib controls in Tg(fli1a:EGFP/ins:DsRed) background. Representative images were taken at 18 dpf by confocal microscopy at 20x magnification. (C) Graphic presentation of the integrated density of fluorescence in the red and green channel in tcf7l2 exI/exI mutant and wild-type sib controls at 18 dpf. The regions for the analysis of integrated density of fluorescence are indicated by white boxes. Data were obtained using Fiji software. (D) Analysis and graphic presentation of vessels diameter; the mutant is characterized by decreased vessel diameter. Data were obtained from five individuals per genotype. All reference to phenotypes was confirmed by genotyping; *p < 0.05. EXPRESSION / LABELING:
PHENOTYPE:
|
|
Heterozygous tcf7l2 exI/+ adults have a reduced rate of caudal fin regeneration. (A) Bright field live images of unamputated and regenerating fins in wild type and tcf7l2 exI/+ after 72 hours post-amputation. The area of regeneration was determined and the original cut line was used to normalize fin size differences. (B) Graphic presentation of the regeneration rate in controls and tcf7l2 exI/+ mutant fish. Data were obtained from six fishes per genotype, repeated in 3 different experiments. PHENOTYPE:
|
|
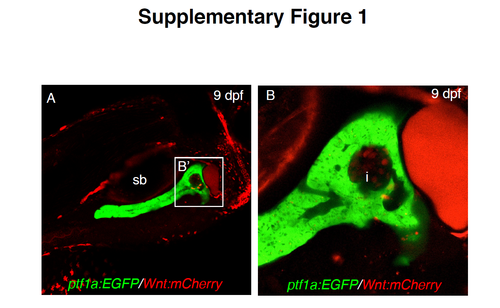
Visualization of Tcf/Lef-dependent expression using a responsive Wnt/b-catenin signaling-reporter transgenic zebrafish. Analysis at 20x (A) and 40x (B) magnification of Wnt-reporter cells (red) in an exocrine pancreas-expressed transgenic line (ptf1a:EGFP) at 9 dpf. All figures are confocal Z-stack projections. The white square (B’) in A indicates the region enlarged in B. sb: swim bladder, i: main endocrine pancreatic islet. |
|
Histology of wild type and tcf7l2 mutant adult pancreas. H&E staining of large principal islet of wt (A) and tcf7l2exI/+ (B) at 9 mpf. White arrowheads point to beta cells. |
|
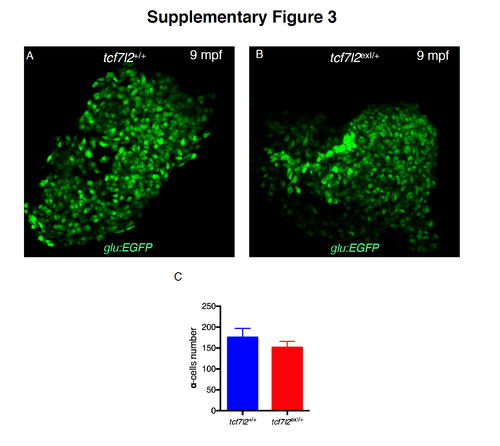
Impact of tcf7l2 deletion on α-cell mass. Representative 2D images from wt and tcf7l2exI/+ pancreata extracted from 9 month-old fish in α cell-specific Tg(glu:eGFP) background. (C) Quantification of α cells in 9-month-old fish. No significant difference between genotypes was observed. |
|
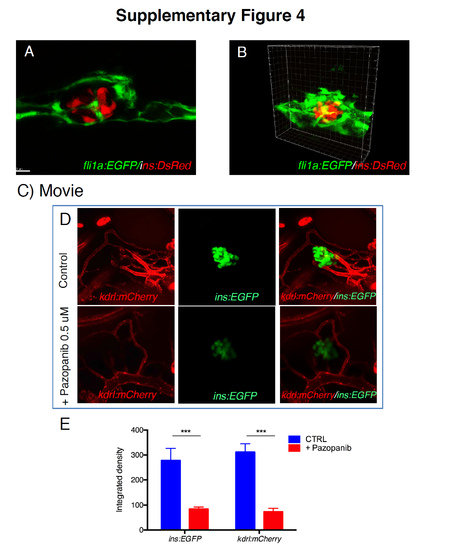
Imaging of pancreatic islet vascularization and treatment with Pazopanib. (A) Confocal section of a 30 hpf endocrine pancreas showing β cells (ins:DsRed) completely surrounded by blood vessels (fli1a:EGFP). Vessels are not only located in contact to the peripheral surface of the pancreatic islets, but also penetrate in the inner region between islets. (B) 3D reconstruction of a 30 hpf endocrine pancreas showing blood vessels wrapped around the β cells. C) Time-lapse video of a 30 hpf pancreatic endocrine islet (red, ins:DsRed) surrounded and penetrated by blood vessels (green, fli1a:EGFP). Full 3D stacks were taken every 10 minutes over a period of 3 hours. (D) Treated larvae were subjected to 0.5 μM Pazopanib treatment for 72 h (from 2 dpf to 5 dpf). (E) Integrated density analysis of fluorescence of 5 dpf zebrafish larvae with or without Pazopanib treatment. Values represent the mean ± SEM. Asterisks indicate that expression levels are significantly different from the control: *** p<0.001. n=6 larvae for each group. |
|
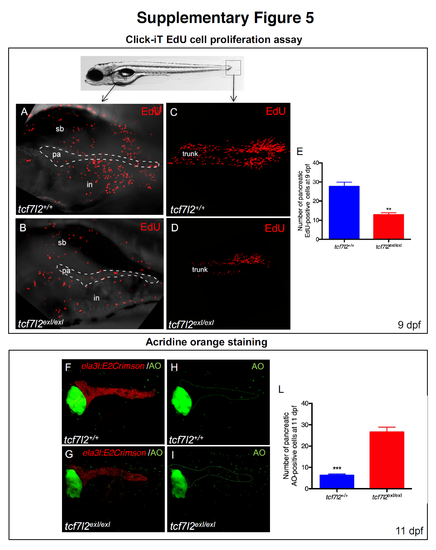
Decreased proliferation and increased cell death in tcf7l2exI/exI. 2D projections of confocal Z-series images of wild type (A) and tcf7l2exI/exI (B) at 9 dpf, showing EdU-positive cells (red) in the pancreatic region (dashed area). C, D: examples of caudal fins of wt and tcf7l2exI/exl mutant analysed by Click-iT EdU cell proliferation assay. Red signals indicate proliferating cells. F-I: Acridine Orange (AO, green dots). E,L: Quantification of EdU (E) and AO (L); n=6 for both charts. sb=swim bladder; pa=pancreas; in=intestine. |
|
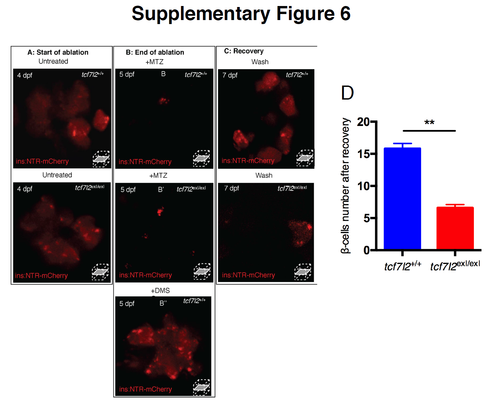
Impaired recovery of pancreatic β cells in tcf7l2exI/exI mutants. Confocal microscopy was used to monitor the progression of ablation in tcf7l2exI/exI and wt in Tg(ins:NTR-mCherry) larvae throughout their treatment with DMSO or Mtz. Control and mutant larvae at 4 dpf before treatment (A), at 5 dpf, after treatment for 24 h (B) with 7 mM Mtz (B,B’) or DMSO (B’’), and at 7 dpf, after 48 h recovery (C). Loss of mCherry in treated individuals indicates that β cells have been successfully ablated; (C) fluorescence levels indicate cell recovery in the wt but not in the tcf7l2exI/exI mutant. (D) Quantification of the number of β cells after recovery of tcf7l2exI/exI and control siblings. Data were obtained from six individuals per genotype. All reference to phenotypes was confirmed by genotyping. Values represent the mean ± SEM. Asterisk above column indicate statistical differences among groups ** p<0.01. |

