- Title
-
A Macrophage Response to Mycobacterium leprae Phenolic Glycolipid Initiates Nerve Damage in Leprosy
- Authors
- Madigan, C.A., Cambier, C.J., Kelly-Scumpia, K.M., Scumpia, P.O., Cheng, T.Y., Zailaa, J., Bloom, B.R., Moody, D.B., Smale, S.T., Sagasti, A., Modlin, R.L., Ramakrishnan, L.
- Source
- Full text @ Cell
|
Early M. leprae-Macrophage Interactions Are Typical of Other Mycobacterial Infections (A) Diagram of larva 2 days post-fertilization (dpf) with injection sites indicated. (B) Representative confocal image of an early aggregate of fluorescent macrophages (dashed line) adjacent to the yolk sac in a 6 dpf mpeg1:Brainbow larva at 4 days post-infection (dpi) with ∼104 fluorescent M. leprae. Scale bar, 10 μm. (C) Mean number of neutrophils recruited to the hindbrain ventricle after injection of ∼100 colony-forming units (CFUs) of P. aeruginosa (Pa), M. marinum, or M. leprae in a 2 dpf larva at 4 hr post-infection; ∗p < 0.05; ∗∗p < 0.01; ∗∗∗p < 0.001 (one-way ANOVA with Bonferroni’s post-test). (D) Mean number of macrophages recruited to M. marinum (Mm) or M. leprae (Mlep) injection, like in (C), in wild-type (ctrl) animals or those made deficient in CCR2 or MyD88 by morpholino (MO) injection; ∗∗∗p < 0.001, ∗∗∗∗p ≤ 0.0001 (one-way ANOVA with Bonferroni’s post-test). (E) Representative fluorescent images of 2 dpi (4 dpf) WT or macrophage-deficient pu.1 morphant larvae, infected with fluorescent M. leprae like in (B); the arrow indicates the injection site. Scale bar, 100 μm. (F) Mean bacterial burden of larvae in (E); unpaired Student’s t test. (G) Representative confocal image of the fluorescent vasculature of a 2 dpi (4 dpf) kdrl:dsRed larva infected with fluorescent M. leprae; bacteria reside within macrophages, apparent by Nomarski microscopy (Figure S1). The arrow indicates M. leprae retained within vessels; arrowheads indicate M. leprae outside of vessels; ISV, intersegmental vessel; asterisk, M. leprae-infected macrophage surrounding the abluminal surface of the vessel. (H) Proportion of larvae in (G) with M. leprae disseminated outside or contained within the vasculature, 4 days after caudal vein infection, in larvae depleted of macrophages, or not, by clondronate injection (Fisher’s exact test). n = number of larvae per group; all data representative of at least three separate experiments. See also Figure S1. PHENOTYPE:
|
|
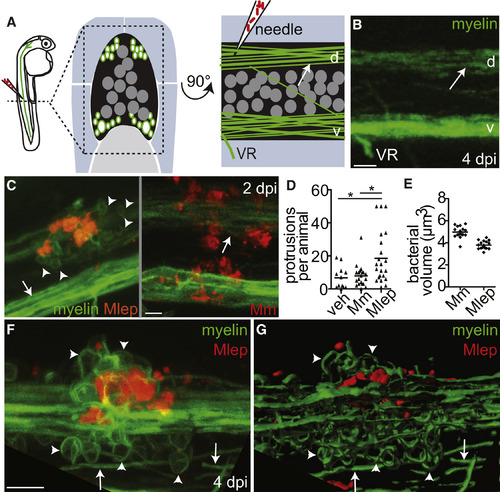
M. leprae Triggers Myelin Dissociation (A) Left, diagram of a spinal cord injection in an mbp:eGFP-CAAX larva (mbp), with fluorescent myelinating membrane, at 4 days post-fertilization (dpf). Transverse (middle) and sagittal (right) views of the region show the spinal cord (black), dorsal (d), and ventral (v) tracts of myelinated axons (green surrounding white axons), neuronal cell bodies (dark gray circles), and the ventral roots of spinal nerves (VR) surrounded by muscle (blue) and notochord (light gray). Arrows indicate intact myelin sheaths surrounding axons. (B) Confocal image corresponding to (A). Scale bar, 10 μm. (C) Representative confocal images of 4 dpf mbp larvae, 2 days post-infection (dpi) with ∼104M. leprae, or ∼200 CFUs of M. marinum; arrowheads indicate myelin protrusions, quantified in (D). Scale bar, 10 μm. (D) Mean number of myelin protrusions per animal following injection with PBS vehicle (veh), M. marinum, or M. leprae (∗p < 0.05; one-way ANOVA, Bonferroni’s post-test). (E) Mean bacterial burden of larvae from (C); measured by fluorescent pixel intensity like in Figure 1F. (F and G) Representative confocal image (F) and rendering (G) of myelin protrusions in a 6 dpf larva 4 dpi with ∼104M. leprae (Movie S1). Scale bar, 10 μm. See also Table S1 and Movie S1. |
|
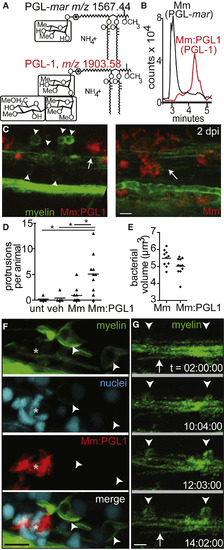
Phenolic Glycolipid 1 Triggers Myelin Dissociation (A) Normal phase high-performance liquid chromatography mass spectrometry measured at the known mass-to-charge ratios (m/z) for triglycosylated and monoglycosylated forms of PGL, leading to the separate detection of PGL-mar (m/z 1,567.44, upper structure) and PGL-1 (m/z 1,903.58, lower structure) in total lipid extracts of the indicated strains (B). (B) Chromatograms of the ions depicted in (A), showing the increased retention time of PGL-1 from M. marinum:PGL-1 (Mm:PGL1) compared to that of PGL-mar from WT M. marinum. (C) Representative confocal images, like in Figure 2C, of 2 dpi (4 dpf) larvae infected with ∼200 CFU M. marinum or M. marinum:PGL-1; myelin protrusions are quantified in (D). Scale bar, 10 μm. (D) Mean number of myelin protrusions per animal in uninjected larvae (unt) or after injection with PBS vehicle (veh), M. marinum, or M. marinum:PGL-1 (∼200 CFU each; ∗p < 0.05, one-way ANOVA with Bonferroni’s post-test). (E) Mean bacterial burden at the injection site of larvae from (D). (F) Representative confocal image of a 6 dpf larva with fluorescently labeled nuclei, 4 dpi with M. marinum:PGL-1 (∼100 CFU). Asterisk indicates an aggregate of infected cells. Scale bar, 10 μm. (G) Stills from time-lapse imaging of an mbp larva injected with M. marinum:PGL-1, showing myelin protrusions forming from apparently intact myelin. Arrow, intact myelin sheath; arrowheads, myelin protrusions. Relative time code. Scale bar, 10 μm. See also Figures S2 and S3 and Movie S2. EXPRESSION / LABELING:
|
|
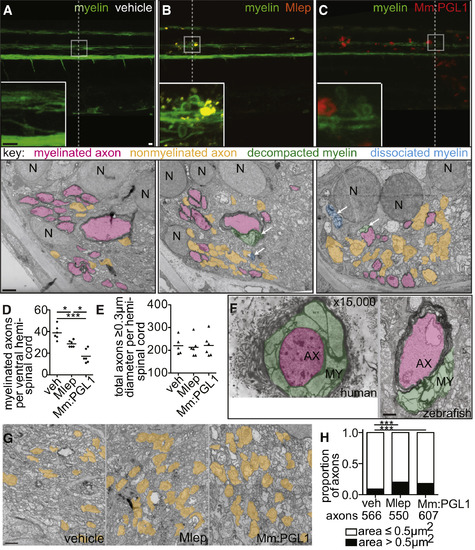
M. leprae Alters Nerve Ultrastructure (A–C) Representative confocal images of the spinal cord injection site (upper; scale bar, 10 μm) in mbp larvae at 2 dpi (5 dpf). Insets show magnifications of boxed regions; dashed lines indicate approximate location of the TEM section, shown below with 1 μm scale bars. Highlights indicate myelinated axons (pink), nonmyelinated axons (orange), decompacted myelin (green highlight and arrows), and myelin dissociated from axons (blue highlight and arrows). N, neuronal cell body. Apparent yellow in (B) is due to colocalization of red M. leprae and green myelin and bleed-through of the red PKH into the green channel. (D and E) Mean number of myelinated axons (D) and total axons (E) per hemi-spinal cord section in larvae injected with PBS vehicle (veh), M. leprae, or M. marinum:PGL-1. (Two hemi-spinal cords scored per larvae; three larvae per group; one-way ANOVA with Bonferonni’s post-test; ∗p < 0.05; ∗∗∗p < 0.001.) (F) Myelin decompaction in a radial nerve biopsy from a leprosy patient (left) (Job 1973, republished with permission), compared to similar alterations in the myelin of a M. leprae-infected larva (right). MY, myelin; AX, axon; highlights indicate myelinated axons (pink) and decompacted myelin (green); scale bar, 1 μm. (G) TEMs of larvae obtained like in (A), through matched anatomical regions. Nonmyelinated axons with diameter ≥ 0.5 μm2 are highlighted in orange; scale bar, 1 μm. (H) Proportion of nonmyelinated axons with area >0.5 or ≤0.5 μm2 from larvae obtained like in (A) (∗∗∗p < 0.001; Fisher’s exact test). See also Figure S3. |
|
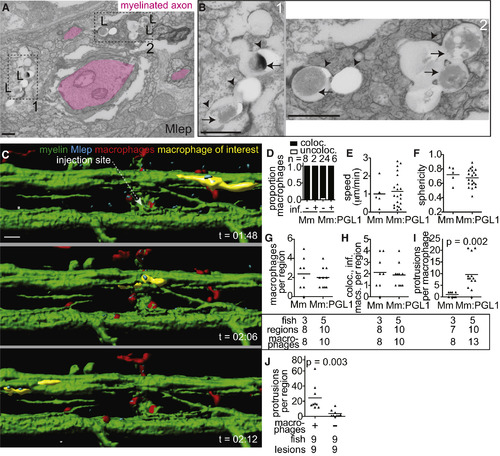
Macrophages Mediate M. leprae Demyelination (A) TEM from 6 dpi (8 dpf) larva showing M. leprae bacilli (L) within a phagocyte contacting a myelinated axon. Dashed line indicated insets 1 and 2, shown in (B); myelinated axons highlighted in pink; scale bar, 1 μm. (B) Insets from (A), showing the M. leprae double membrane (arrows) and phagosomal membranes (arrowheads); scale bar, 1 μm. (C) Rendered still images from a time-lapse movie (Movie S6) of an M. leprae-infected double-transgenic mbp;mpeg1 larva with fluorescent macrophages and myelinating membrane. At 4 days post-fertilization, the larva was infected in the spinal cord and immediately imaged for 12 hr, revealing infected macrophages patrolling intact myelin sheaths (a myelin-patrolling, infected macrophage highlighted in yellow). Scale bar, 10 μm. (D) Proportion of uninfected (−) or infected (+) macrophages that colocalized with myelin in 4 dpf larvae infected with M. marinum or M. marinum:PGL-1. n = number of macrophages scored. (E) Mean speed of macrophages in the larvae from (D). (F) Mean sphericity of macrophages in the larvae from (D). (G) Mean number of macrophages per infected region in (5 dpf) mbp larvae 2 dpi with M. marinum or M. marinum:PGL-1. Numbers of fish, regions, and macrophages scored per group are indicated. (H) Mean number of macrophages per region that were both infected and myelin colocalized in the larvae from (G). (I) Mean number of myelin protrusions per macrophage in the larvae from G. Student’s t test. (J) Myelin protrusions per M. leprae-infected region in WT mbp larvae (+) or those depleted of macrophages (−) by injection with irf8 morpholino and lipo-clodronate. Student’s t test. Data are representative of at least two separate experiments. See also Figure S4 and Movies S3, S4, S5, S6, S7, and S8. |
|
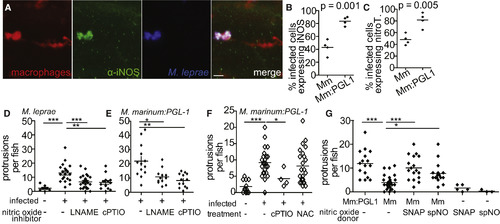
Nitric Oxide Is Necessary for Early Demyelination (A) Representative confocal images of a macrophage aggregate in the spinal cord of an mpeg1 larva infected with M. leprae and stained with α-iNOS antibody. Scale bar, 10 μm. (B) Mean percentage of infected mpeg1-positive macrophages that also express iNOS in 7 dpf larvae 5 dpi with WT M. marinum or M. marinum:PGL-1. (Student’s t test.) (C) Mean percentage of infected mpeg1-positive macrophages that stain with α-nitrotyrosine antibody (nitroT) in larvae like in (B). (Student’s t test). (D) Mean number of myelin protrusions per animal in 5 dpf mbp larvae 2 dpi with M. leprae, which were treated with 0.5% DMSO vehicle (-), iNOS inhibitor (L-NAME), or ROS/RNS scavenger (cPTIO). (∗∗p < 0.01; ∗∗∗p < 0.001; one-way ANOVA with Dunnett’s multiple comparison test.) (E) Mean number of myelin protrusions per animal in 5 dpf mbp larvae 2 dpi with M. marinum:PGL-1, treated like in (D). (∗p < 0.05; ∗∗p < 0.01; one-way ANOVA with Dunnett’s multiple comparison test.) (F) Mean number of myelin protrusions per animal in 5 dpf mbp larvae 2 dpi with M. marinum:PGL-1, which were treated with 0.5% DMSO vehicle (“-”), nitric oxide scavenger (cPTIO), or ROS scavenger NAC. (∗p<0.05; ∗∗∗p<0.001; one-way ANOVA with Dunnett’s multiple comparison test.) (G) Mean number of myelin protrusions per animal in larvae infected like in (F), which were soaked post-injection in 0.5% DMSO vehicle (“-”) or in nitric oxide donors SNAP or spermine NONOate (spNO). (∗p<0.05; ∗∗∗p<0.001; one-way ANOVA with Dunnett’s multiple comparison test.) See also Figure S5. EXPRESSION / LABELING:
PHENOTYPE:
|
|
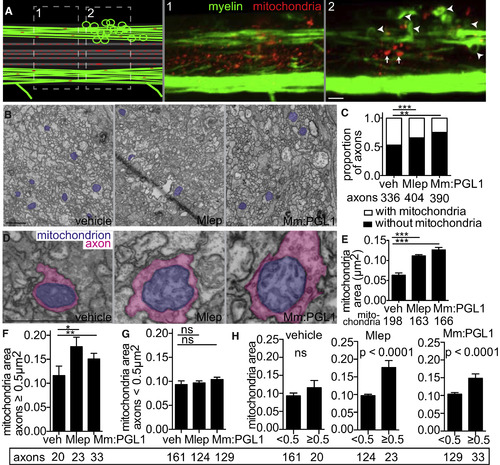
M. leprae Infection Damages Axonal Mitochondria (A) Diagram (left) of a demyelinating lesion in a 2 dpi (5 dpf) mbp larva with fluorescent mitochondria in axons. Dashed boxes indicate insets 1 and 2, with corresponding confocal images, showing mitochondria outside the lesion (inset 1) and those within the lesion (inset 2). Arrowheads indicate myelin protrusions; arrows indicate enlarged mitochondria. Scale bar, 10 μm. (B) Representative TEMs of matched anatomical regions showing the number of axon mitochondria (purple) in larvae injected with PBS, M. leprae, or M. marinum:PGL-1. Scale bar, 1 μm. (C) Proportion of axons with mitochondria to those without, in larvae like in (B); the number of axons scored are listed below (contingency analysis corrected for multiple comparisons; ∗∗p = 0.004; ∗∗∗p < 0.0002). (D) Representative TEMs of enlarged mitochondria (purple) within enlarged axons (pink), in larvae like in (B). Scale bar, 1 μm. (E) Mean (±SEM) area of mitochondria in axons, in larvae like in (B); number of mitochondria scored are listed below. (∗∗∗p < 0.001; one-way ANOVA with Dunnett’s multiple comparison.) (F) Mean (±SEM) area of mitochondria in nonmyelinated axons with area ≥0.5 μm2, in larvae like in (B) (∗p < 0.05, ∗∗p < 0.01; one-way ANOVA with Dunnett’s multiple comparison). (G) Mean (±SEM) area of mitochondria in nonmyelinated axons with area <0.5 μm2, in larvae like in (B) (one-way ANOVA with Dunnett’s multiple comparison). (H) Data from (F) and (G) are displayed per experimental group, showing mean (±SEM) area of mitochondria in large versus small nonmyelinated axons (one-way ANOVA with Dunnett’s multiple comparison). PHENOTYPE:
|
|
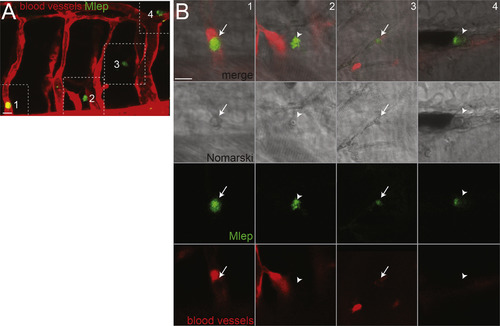
M. leprae-Infected Macrophages Escape Circulation, Related to Figures 1G and 1H (A) Confocal image from Figure 1G of a 4 dpf kdrl:dsRed larva, which has fluorescent blood vessels, 2 days post-infection (dpi) with fluorescent M. leprae; dashed lines define insets (1-4) shown in B. 10 μm bar. (B) Monochannel and merged images of insets from A, showing M. leprae within cells, likely macrophages, which are visible by Nomarski microscopy. Arrows, intracellular M. leprae retained in vessels; arrowheads, intracellular M. leprae outside vessels. 10 μm bar. |
|
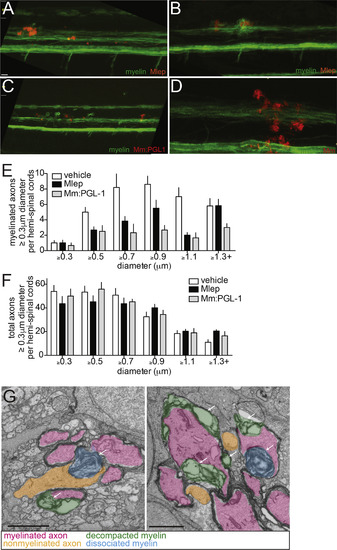
Nerve Damage in Infected Larvae, Related to Figures 3C and 4. Lower magnification views of mbp:eGFP-CAAX larvae at 2 dpi (4 dpf) or 4 dpi (6 dpf) with M. leprae and M. marinum:PGL-1, showing the apparently intact myelin sheath outside of the lesion (M. marinum shown for comparison). 10 μm bar. (A) 2 dpi, M. leprae. (B) 4 dpi, M. leprae. (C) 2 dpi, M. marinum:PGL-1. (D) 2 dpi, WT M. marinum. (E) Mean (±SEM) number of myelinated axons randomly selected (see the STAR Methods) in the hemi-spinal cords of 5 dpf larvae 2 days post-injection (dpi) with PBS control vehicle (white), M. leprae (black) or M. marinum:PGL-1 (gray). 3 larvae per group. (F) Mean (±SEM) number of total axons, quantified as in (E). (G) Two additional examples of myelin decompaction and dissociation in the spinal cords of M. leprae-infected fish from Figure 4B. Highlights indicate myelinated axons (pink), nonmyelinated axons (orange), decompacted myelin (green highlight and arrows), and myelin dissociated from axons (blue highlight and arrows). 10 μm bars. |
|
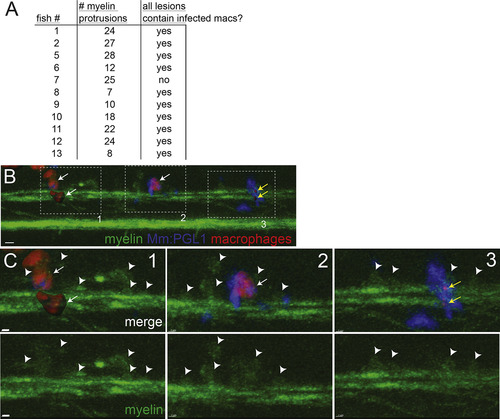
Association of Infected Macrophages with Demyelinating Lesions, Related to Figure 5I At 2 days post-infection (5 dpf), nerve lesions were identified in M. marinum:PGL-1-infected mbp:eGFP-CAAX; mpeg1:Brainbow larvae (Figure 5I). (A) Each lesion was scored for presence or absence of infected macrophages; association of infected macrophages with myelin protrusions was deemed significant (p = 0.01) with a two-tailed binomial test. (B) Lesion from fish #7 (A), which had 3 demyelinating lesions (dashed boxes). For clarity, red macrophages or fragments of their red membrane are shown as rendered objects; green myelin and blue bacteria are show as the unmodified fluorescent images. 10 μm bar. (C) Insets of each lesion from B, showing myelin protrusions and colocalized, infected macrophages that are still intact (1 and 2) or fragmented (3) and dead. Arrowheads indicate myelin protrusions; for clarity, not every myelin protrusion that was scored is indicated with an arrowhead. White arrows, intact macrophages; yellow arrows, fragments of dsRed-positive macrophage membrane. 10 μm bars. |
|
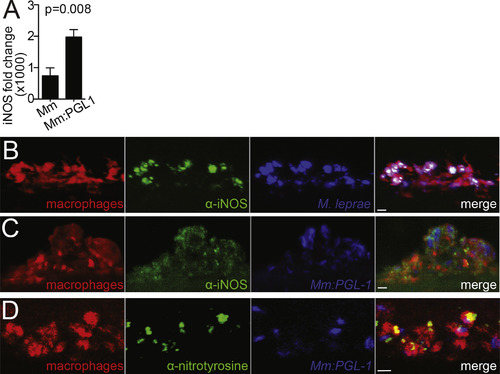
Nitric Oxide Production in Infected Macrophages, Related to Figure 6 (A) Mean (±SEM) fold change of Nos2 (iNOS) transcript in WT murine macrophages, 6 hr after infection with WT M. marinum or M. marinum:PGL-1 (both MOI 1), compared to uninfected cells. (Average of 3 independent experiments; Student’s t test). (B) Representative confocal images of a macrophage aggregate in an mpeg1 larva infected with M. leprae and stained with α-iNOS antibody. 10 μm bar. (C) Representative confocal images of a macrophage aggregate in an mpeg1 larva infected with M. marinum:PGL-1 and stained with α-iNOS antibody. 10 μm bar. (D) Representative confocal images of a macrophage aggregate in larvae as in C, stained with α-nitrotyrosine antibody. 10 μm bar. |
Reprinted from Cell, 170, Madigan, C.A., Cambier, C.J., Kelly-Scumpia, K.M., Scumpia, P.O., Cheng, T.Y., Zailaa, J., Bloom, B.R., Moody, D.B., Smale, S.T., Sagasti, A., Modlin, R.L., Ramakrishnan, L., A Macrophage Response to Mycobacterium leprae Phenolic Glycolipid Initiates Nerve Damage in Leprosy, 973-985.e10, Copyright (2017) with permission from Elsevier. Full text @ Cell


