- Title
-
Sheath Cell Invasion and Trans-differentiation Repair Mechanical Damage Caused by Loss of Caveolae in the Zebrafish Notochord
- Authors
- Garcia, J., Bagwell, J., Njaine, B., Norman, J., Levic, D.S., Wopat, S., Miller, S.E., Liu, X., Locasale, J.W., Stainier, D.Y.R., Bagnat, M.
- Source
- Full text @ Curr. Biol.
|
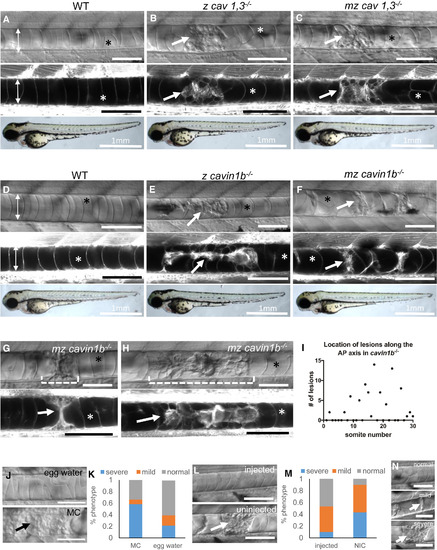
Loss of Caveolae Renders Notochord Vacuolated Cells Prone to Mechanical Disruption during Locomotion (A–F) DIC (top), confocal (middle), and bright-field images (bottom) of 72 hpf live MED-labeled WT, zygotic (z) cav1, 3−/−, maternal zygotic (mz) cav1, 3−/−, z cavin1b−/−, and mz cavin1b−/− larvae. (G and H) DIC and confocal images of a single live MED-labeled cavin1b−/− mutant at 72 (G) and 96 hpf (H). The dashed brackets mark an area with a notochord lesion that was imaged over time. (I) Distribution of notochord lesions along the anterior-posterior (AP) axis of 72 hpf z cavin1b−/− larvae (n = 30 fish). (J and K) 24 hpf embryos from a cavin1b+/− cross were de-chorionated and placed in 3% methyl cellulose (MC) or egg water and scored for notochord lesion severity at 72 hpf. p < 0.001, Fisher’s exact test; n = 83 (MC), n = 89 (egg water). (L and M) Embryos were injected with 200 pg α-bungarotoxin and scored at 72 hpf. p < 0.001, Fisher’s exact test; n = 94 (injected), n = 74 (non-injected control, NIC). (N) Classification of lesion severity. Scale bars, 100 μm unless marked otherwise. Double arrows mark the width of the notochord, arrows point to notochord lesions, and asterisks mark intact vacuoles. Error bars are SD. See also Figures S1–S4. PHENOTYPE:
|
|
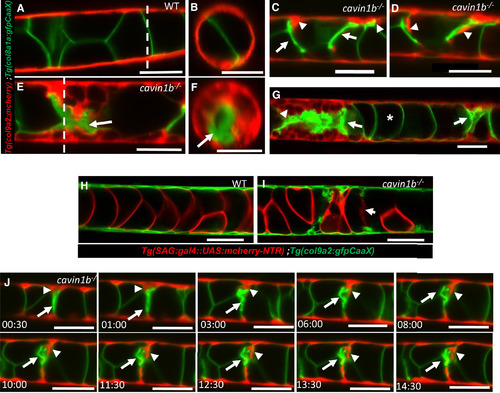
Collapse of Vacuolated Cells Triggers Sheath Cell Invasion (A and B) Lateral and orthogonal views of a live 72 hpf WT larva expressing col8a1a:GFPCaaX in vacuolated cells and col9a2:mcherry in sheath cells. The dashed lines in (A) mark the AP level in which the optical cross sections shown in (B) were taken. (C and D) In cavin1b mutants with mild lesions, individual sheath cells wedge and invade the inner notochord where vacuolated cells have collapsed. (E and F) Lateral and orthogonal views of a live 72 hpf cavin1b mutant with severe lesions showing multiple invading sheath cells. The dashed lines in (E) mark the AP level at which the optical cross sections shown in (F) were taken. (G) Confocal image of a live 72 hpf cavin1b mutant with two notochord lesions in close proximity (arrows). The asterisk marks an intact vacuolated cell. (H and I) Confocal images of a live 72 hpf WT and a cavin1b−/− mutant expressing sag:gal4::UAS:mcherry-NTR in vacuolated cells and col9a2:GFPCaaX in sheath cells. Collapsed vacuolated cells lose cytoplasmic contents. (J) Still frames from a 15-hr LSM time-lapse movie showing sheath cells expressing col9a2:mcherry invading the inner notochord next to a collapsed vacuolated cell expressing col8a1a:GFPCaax. Arrows point to a collapsed vacuolated cell; arrowheads indicate an invading sheath cell. Scale bars, 50 μm. Error bars are SD. See also Figures S2–S4 and Movies S1 and S2. EXPRESSION / LABELING:
PHENOTYPE:
|
|
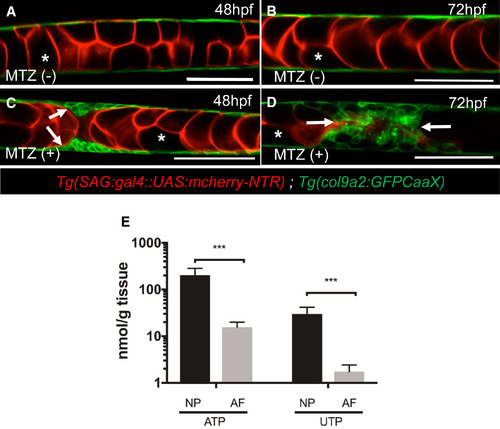
Release of Vacuolated Cell Contents Triggers Sheath Cell Invasion (A and B) Confocal images of live WT embryos expressing sag:gal4::UAS:mcherry-NTR in vacuolated cells and col9a2:GFPCaaX in sheath cells. (C and D) In embryos treated with 1.5 mM metronidazole (MTZ), sheath cells invade areas of vacuolated cell death. Arrows point to invading sheath cells; asterisks mark intact vacuolated cells. (E) LC-MS quantitation of ATP and UTP levels in nucleus pulposus (NP) and annulus fibrosis (AF) tissue isolated from 6-month-old pig spines. n = 12 for NP and 4 for AF. ∗∗∗p < 0.001, Student’s t test. The scale bars represent 100 μm. Error bars are SD. See also Figures S3 and S4. EXPRESSION / LABELING:
PHENOTYPE:
|
|
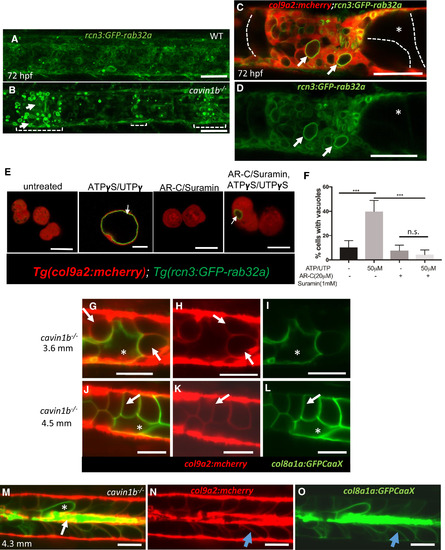
Invading Sheath Cells Differentiate into Vacuolated Cells (A and B) Projections of confocal stacks of 72 hpf WT and cavin1b−/− larvae expressing rcn3:GFP-rab32a and col9a2:mcherry. Brackets mark areas of vacuolated cell collapse and sheath invasion; arrows point to new vacuoles in sheath cells. (C and D) Following invasion, sheath cell vacuoles (arrows) enlarge. Intact primary vacuolated cells are traced with dashed lines. The asterisks mark an intact vacuolated cell. (E) Confocal images of live sheath cells obtained from 48 hpf embryos expressing col9a2:mcherry and rcn3:GFP-rab32a. Cells were treated with suramin and AR-C 118925XX (AR-C) or ATPγS/UTPγS or left untreated for 2 hr. Arrows point to newly formed vacuoles. (F) Quantitation using one-way ANOVA followed by multiple comparisons using Tukey’s test, ∗∗∗p < 0.001; n.s., not significant; n = 3 experiments. (G–O) LSM imaging of cavin1b mutants expressing col8a1a:GFPCaax and col9a2:mcherry. (G–I) 3.6-mm fish. Arrows point to vacuolated sheath cells; asterisks mark a primary vacuolated cell. (J–L) 4.5-mm cavin1b−/− fish showing new vacuolated cells that retained col9a2:mcherry expression (arrows) next to a primary vacuolated cell (asterisks). (M–O) 4.3-mm cavin1b−/− fish with remnants of primary vacuolated cells (arrow), a primary vacuolated cell (asterisk), and newly differentiated vacuolated cells (blue arrows). Scale bars, 50 μm. Error bars are SD. See also Figures S3 and S4. EXPRESSION / LABELING:
PHENOTYPE:
|
|
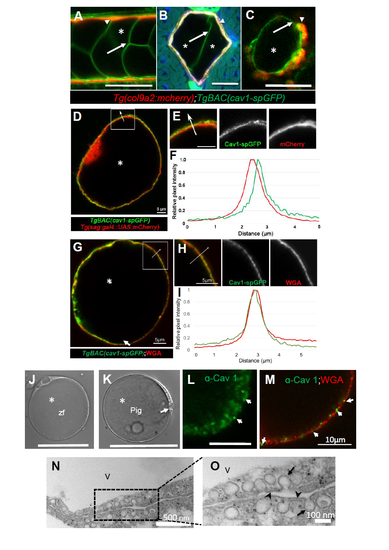
Caveolin 1 is a conserved vacuolated cell membrane protein in the vertebrate notochord. Related to Figure 1. A-C: Confocal images of a 72 hpf larva expressing col9a2:mcherry, BAC(cav1-spGFP). A: Live image. Arrows point to vacuolated cell membranes, asterisks mark vacuole lumen. B: Cross section. Arrows point to vacuolated cell membranes, asterisks mark vacuole lumen. C: Live image of a partially dissociated notochord showing that Cav1-GFP is expressed in both vacuolated and sheath cells. Arrowhead points to a sheath cell. D,F: Live image of a vacuolated cell isolated from a 48 hpf zebrafish embryo expressing BAC(cav1- spGFP) and sag:Gal4; UAS:mcherry-NTR;. Cav1-spGFP exhibits a punctate pattern that is separated from the cytoplasmic mcherry signal as shown by a line scan (F) along the arrow. G-I: Live image of a vacuolated cell isolated from a 48 hpf zebrafish embryo expressing BAC(cav1- spGFP) and stained with Alexa-594 WGA to label cell surface glycans. Cav1-spGFP exhibits a punctate pattern at the plasma membrane similar to that of WGA as shown by a line scan (I) along the arrow. J: DIC image of a vacuolated cell isolated from a 72 hpf zebrafish larva. Scale bar 50µm. K: DIC image of a vacuolated cell isolated from the nucleus pulposus (NP) of a 6 months old pig. Scale bar 50µm. L: Thick optical section confocal image of a portion of a pig vacuolated cell stained for Cav1. The antibody labels punctae at the cell surface. Arrows point to plasma membrane Cav1+ punctae. Scale bar: 5µm. M: Thin optical section confocal image of a portion of a pig vacuolated cell stained for Cav1 and WGA. N-O: Transmission electron micrographs of NP issue. Abundant caveolae (arrows) are present at the plasma membrane (arrow heads) in two neighboring cells. V marks a vacuole. |
|
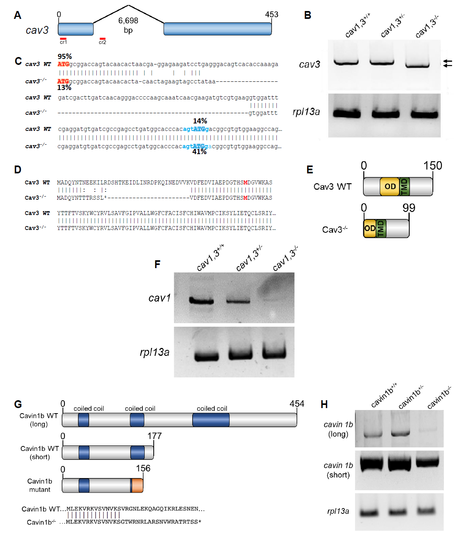
Generation and molecular characterization of cav3 and cavin1b mutants. Related to Figure 1 and 2. A: Generation of cav3pd1149 allele. Two guide RNAs were injected simultaneously to delete a genomic region spanning most of exon one and part of the first intron. B: RT-PCR using primers pairing in the 5’ and 3’ UTR of cav3 revealed that the cav3pd1149 is spliced to produce a slightly shorter transcript. WT and mutant transcripts are marked by arrows rpl13a was used as standard. C: cDNA sequence of WT and cav3pd1149 mutant transcripts. The % next to each ATG codon indicates the probability of functioning as a start site. The Kozac sequence of the alternative start site is indicated in blue. D: Predicted protein sequence produced by the WT and cav3pd1149 mutant transcripts. The genomic deletion creates an early stop codon and a deletion of part of the N-terminus in the mutant. The alternative first aa is indicated in bold. E: Domain structure of WT and mutant Cav3. The N-terminus and part of the oligomerization domain (OD) are eliminated, leaving the trans-membrane domain (TMD) and the C-terminus intact. F: RT-PCR of α/β cav1. Both cav1 transcripts largely decay in cav1, 3 mutants. rpl13a was used as standard. G: Domain structure of Cavin1b showing the isoforms corresponding to the long and short transcripts and the predicted mutated protein. The mutation affects both transcripts and generated an early stop codon after a short stretch of missense sequence. H: RTPCR showed that in cavin1b mutants the long transcript decays, whereas the short transcript still persists in the mutants. rpl13a was used as standard. |
|
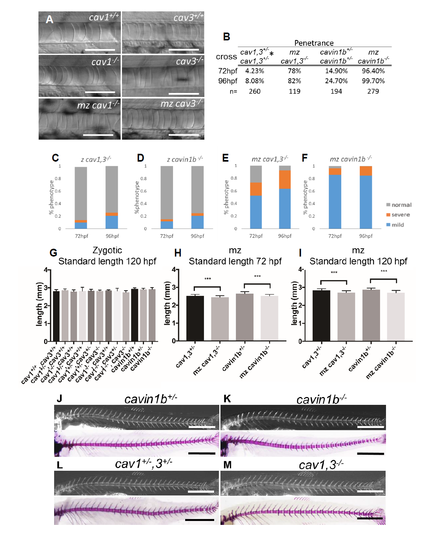
Phenotypic characterization of caveolar mutants. Related to Figure 1, 2, 3 and 4. A: DIC images of notochords of 72 hpf WT and zygotic or maternal zygotic (mz) cav1-/-, or zygotic and mz cavin1b-/-. No anatomical or notochord phenotypes were observed. Scale bars=100μm . B: Analysis of penetrance for zygotic or mz mutants. Values correspond to fraction of the fish with notochord phenotype. * Note that for the cav1,3+/- cross the penetrance at 96 hpf is higher than expected due to the fact that up to 87% of cav3-/-, cav1+/- larvae present notochord phenotype. C-F: Analysis of severity of notochord phenotype in zygotic and mz cav1, 3 and cavin1b mutants. Fish were scored as indicated (Fig 1L). n=260, 194, 82, and 279 respectively. G: Body length measurements of genotyped 120 hpf larvae from cav1,3+/- and cavin1b+/- incrosses. No significant differences were detected. One-way ANOVA, Tukey’s test, p=0.29, n=13, 54, 46, 48, 151, 117, 117, 11, 53, 47, 56, 94, 41 respectively H-I: Body length measurements of 72 and 120 hpf mz cav1, 3-/-, cavin1b-/- and cav1,3+/- and cavin1b+/-. Due to the slightly earlier onset of the notochord phenotype respect to zygotic mutants, mz mutants show a small but significant reduction in body length compared to heterozygous fish. One-way ANOVA with Tukey’s test, ***p<0.001, n=83, 81, 73, 70, 74, 81, 73, 70 respectively. J-K: Live calcein staining (top panel) and alizarin red skeletal preparations (bottom panel) of WT and mz cavin1b-/- mutant fish. No spine defects were detected (n=19 mutants). Scale bars=1mm . L-M: Live calcein staining (top panel) and alizarin red skeletal preparations (bottom panel) of WT and mz cav1, 3-/- . No spine defects were detected (n=26 mutants). Scale bars=1mm. |
|
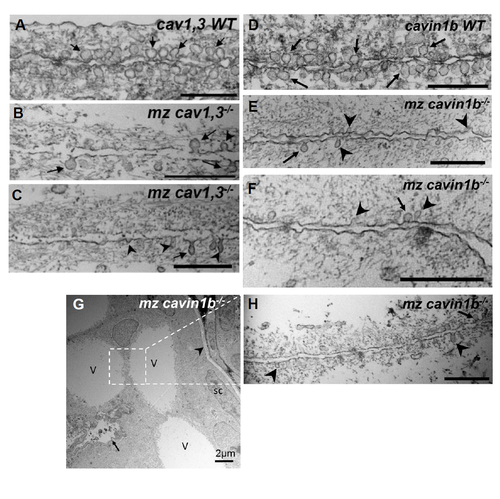
Ultrastructural analyses of caveolar mutants. Related to Figure 1, 2, 3 and 4. A-C: Transmission electron microscopy (TEM) images of 72 hpf WT and mz cav1, 3-/- larvae taken from areas of the inner notochord where two vacuolated cells meet. In WT we detected an average of 6 caveoalae per μm of plasma membrane, whereas there were only 1/μm in mz cav1, 3-/- larvae. Arrows point to omega shaped caveolae and arrowheads point to dysmorphic caveolae. D-F: TEM images of 72 hpf WT and mz cavin1b-/- larvae taken from areas of the inner notochord where two vacuolated cells meet. In WT we detected an average of 6.8 caveoalae per μm of plasma membrane, whereas there were only 1.5/μm in mz cavin1b-/- larvae. Arrows point to omega shaped caveolae and arrowheads point to dysmorphic caveolae. G: Low magnification TEM image of a mz cavin1b-/- larvae with a severe notochord lesion. Several newly vacuolated cells, marked V, were found next to the remnants of a collapsed primary vacuolated cell, marked with an arrow (see also Fig. 2D and Fig. 4). The arrowhead marks the matrix around the sheath, sc=sheath cell. H: TEM image of an area were to newly vacuolated cells meet. As shown for primary vacuolated cells, few caveolae are found at the plasma membrane (arrow) and dysmorphic caveolae (arrowheads) are also present. Scales bars are 500 nm. |

