- Title
-
Characterization of γδ T Cells from Zebrafish Provides Insights into Their Important Role in Adaptive Humoral Immunity
- Authors
- Wan, F., Hu, C.B., Ma, J.X., Gao, K., Xiang, L.X., Shao, J.Z.
- Source
- Full text @ Front Immunol
|
Flow cytometry (FCM) and immunofluorescence analyses of γ+δ+ cells in zebrafish. (A) FCM detection of γ and δ single-positive (γ+ and δ+) cells in leukocytes from zebrafish peripheral blood, head kidney, and spleen tissues, respectively. The left panels show FSC/SSC analyses and the red-outlined gates represent lymphoid cells. Middle panels represent the cells treated only with the secondary Ab (FITC-conjugated goat anti-rabbit IgG or PE-conjugated goat anti-mouse IgG) and with the preimmunization serum. The right panels represent staining of cells with rabbit anti-γ or mouse anti-δ Abs. (B) FCM detection of γδ-double positive (γ+δ+) cells in leukocytes from zebrafish peripheral blood, head kidney, and spleen tissues. FSC/SSC analyses are shown in the left panel and red-outlined gate represents lymphoid cells. The middle panel shows the analysis of cells incubated only with secondary Abs and with the preimmunization serum. The right panel represents double staining of cells with rabbit anti-γ and mouse anti-δ Abs. (C) Confocal microscopy image of γ+δ+ cells stained with rabbit anti-γ and mouse anti-δ Abs. Non-related Abs, including mouse IgG and rabbit IgG, were used as negative controls (data not shown). DAPI stain showed the locations of the nuclei. A laser-scanning confocal microscopy (Zeiss LSM-710) was used in the analyses (original magnification ×630, scale bar, 10 µm). (D) Enlarged images of γ+δ+ cells in the white-outlined square of E. Scale bar, 5 µm. |
|
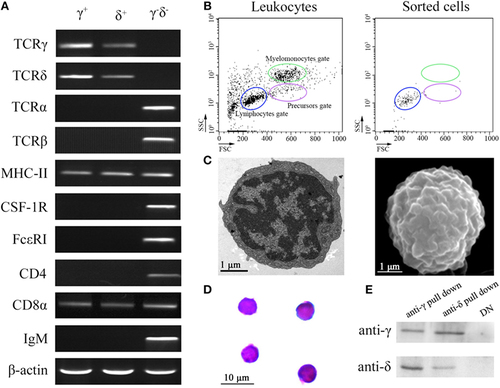
Cellular and molecular identification of zebrafish γδ T cells. (A) RT-PCR assay analyzed the expression of T cell markers (γ, δ, α, β, CD4, and CD8), antigen-presenting cell marker (MHC-II), B cell marker (mIgM), and myeloid cell (monocyte/macrophage and dendritic cell) markers (CSF-1R and FcεRI). The expressions of these markers from negative selection cells were used as control. (B) FCM analyzed the FSC/SSC profiles of leukocytes and the sorted cells. (C) Transmission electron microscopy and scanning electron microscopy show the detailed morphologies of sorted γδ T cells. Scale bar 1 µm (bottom left). (D) Wright-Giemsa staining indicates the morphologies of the sorted γδ T cells. Scale bar 10 µm (bottom left). Original magnification ×1,000. (E) Detect the expressions of γ and δ in the anti-γ and anti-δ pull down cells, respectively, by Western blot. |
|
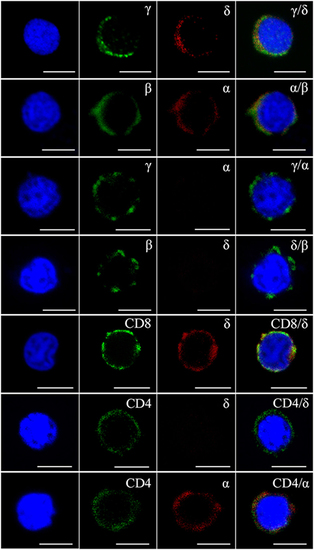
Figure 3. Immunophenotype analysis of zebrafish γδ T cells by Abs against various surface molecules. The magnetic sorted cells were double stained with anti-γ, anti-δ, anti-α, anti-β, anti-CD8, and anti-CD4 Abs in different combinations (rabbit anti-γ/mouse anti-δ, rabbit anti-β/mouse anti-α, rabbit anti-γ/mouse anti-α, rabbit anti-β/mouse anti-δ, rabbit anti-CD8/mouse anti-δ, rabbit anti-CD4/mouse anti-δ, and rabbit anti-CD4/mouse anti-α, respectively). Positive control cells were stained with rabbit anti-β and mouse anti-α Abs. Non-related Abs, including mouse IgG and rabbit IgG, were used as negative controls (data not shown). DAPI stain showed the locations of the nuclei. A laser-scanning confocal microscopy (Zeiss LSM-710) was used in the analyses (original magnification × 630, scale bar, 5 µm). |
|
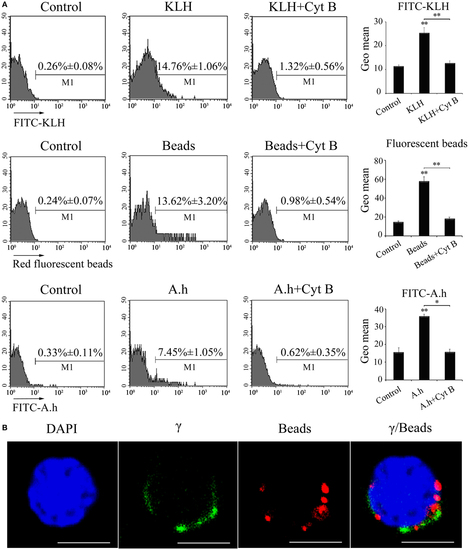
Phagocytic ability of zebrafish γδ T cells. (A) FCM detected the phagocytic ability. γδ T cells were magnetically sorted and incubated with FITC-KLH, 1 µm red fluorescent latex beads or FITC-A.h at 28°C for 4 h. Cells in control group for active phagocytosis were incubated in ice. In parallel, γδ T cells incubated with FITC-KLH, red fluorescent beads, and FITC-A.h (28°C for 4 h) in the presence of cytochalasin B were set as controls. The numbers above the marker bars in each panel indicate the percentages of phagocytic γδ T cells. The geometric means of the fluorescence intensities computed from the outlined region represent the phagocytic ability of γδ T cells in each treatment group. Means ± SD of three independent experiments are shown. *P < 0.05, **P < 0.01. (B) Confocal microscopy of 1 µm red fluorescent latex beads by γδ T cells. DAPI stain showed the location of the nuclei. Original magnification ×630. Scale bar, 5 µm. |
|
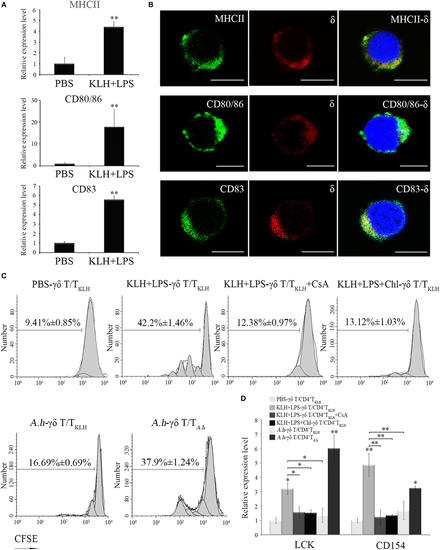
In vitro evaluation of Ag-presenting capacity of zebrafish γδ T cells. (A) Real-time PCR analyses of the expression levels of MHC-II, CD80/86, and CD83 in PBS- and KLH, plus LPS-loaded γδ T cells in vitro. (B) Immunofluorescence staining of δ+MHC+, δ+CD80/86+, and δ+CD83+ cells. Leukocytes were stained with mouse anti-δ and rabbit anti-MHCII, CD83, and CD80/86, respectively. Non-related Abs, including mouse IgG and rabbit IgG, were used as negative controls (data not shown). DAPI stain showed the locations of the nuclei. Original magnification ×630. Scale bar, 5 µm. (C) The proliferation and activation of CD4+ TKLH cells primed by Ag-loaded γδ T cells were determined after CFSE dilution and measured via FCM. The proliferation of CD4+ TKLH cells primed by mock PBS-treated γδ T cells served as a negative control. Cyclosporine A was used for the T cell inhibitor control. For the Ag-presentation inhibition control, γδ T cells was pretreated with Chloroquine for 1 h and then incubated with Ags. In cross-stimulation control group, the KLH-pulsed γδ T cells were co-cultured with CFSE-labeled CD4+ TA.h cells. The numbers above the marker bars indicate the percentage of CFSE-diluted cells in each panel. Data represent three independent experiments. (D) The expression levels of Lck and CD154 were detected through real-time PCR. Means ± SD of three independent experiments are shown. *P < 0.05, **P < 0.01. |
|
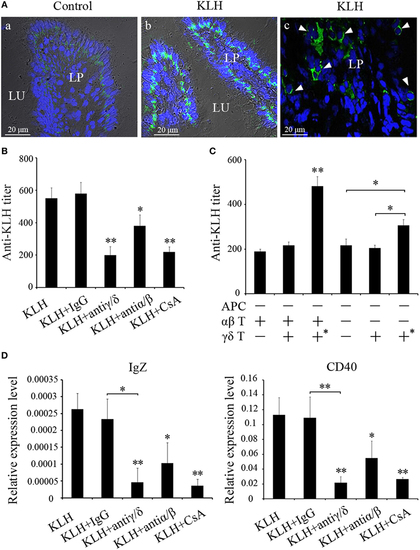
Evaluation of zebrafish γδ T cells in mucosal IgZ production. (A) Differential interference contrast images of immunofluorescence staining of zebrafish hind-gut cryosections from control fish (a) and fish that had been stimulated with KLH (b), stained for DrTRGC (green) and nuclei are stained with DAPI. Enlarged images of the LP (c), without differential interference contrast, showing infiltrating γδ T cells that marked with white arrows in the gut lamina propria. LP represents lamina propria and Lu represents gut lumen. (B) The titers of IgZ against KLH in each treatment group were examined by ELISA. The control groups immunized with KLH only. (C) ELISA for KLH-specific IgZ Abs in the intestine mucus from the recipient fishes with adoptive transfer in different-treatment combinations. All the treatments and combinations were consistent to that shown in Figure 8B. The titer was ascertained based on the highest serum dilution at which the A450 ratio (A450 of postimmunization sera/A450 of preimmunization sera) is ≥ 2.1. The data of the background control group with PBS administration were subtracted from each experimental group. (D) The expression levels of IgZ and CD40 in the metenteron were determined by real-time PCR. Means ± SD of three independent experiments are shown. *P < 0.05, **P < 0.01. |


