- Title
-
Congenital myopathy results from misregulation of a muscle Ca2+ channel by mutant Stac3
- Authors
- Linsley, J.W., Hsu, I.U., Groom, L., Yarotskyy, V., Lavorato, M., Horstick, E.J., Linsley, D., Wang, W., Franzini-Armstrong, C., Dirksen, R.T., Kuwada, J.Y.
- Source
- Full text @ Proc. Natl. Acad. Sci. USA
|
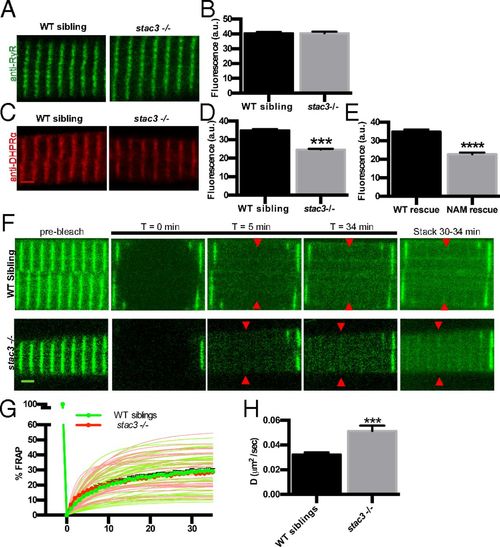
DHPRα1 but not RyR1 is reduced in T-tubule striations of stac3 mutants. (A) Immunofluorescence labeling of WT sibling and stac3−/− disassociated myotubes with anti-pan RyR (34c). (B) Mean immunofluorescence intensity of anti-RyR in stac3−/− compared with WT siblings showing no difference in triadic RyR (t test, P = 0.89, n = 85 WT sibling, n = 50 stac3−/−). a.u., arbitrary units. (C) Immunofluorescence labeling of WT sibling and stac3−/− disassociated myotubes with mAb1 1A against a cytoplasmic region of DHPRα1S (15). (D) Mean mAb1 1A labeling in WT siblings and stac3−/− showing a decrease in triadic DHPRα1S (t test, ***P < 0.0001, n = 216 WT sibling, n = 264 stac3−/−). (E) Quantification of the mean of immunofluorescence labeling of anti-DHPRα1S in stac3−/− expressing stac3NAM (NAM rescue) at triads compared with stac3−/− expressing stac3WT (WT rescue) (n = 75 stac3−/−; stac3WT, n = 53 stac3−/−; stac3NAM, t test, ****P < 0.0001). (F) Time course for FRAP of EGFP-DHPRα1S expressed in WT siblings and stac3−/− myofibers. Shown are EGFP-DHPRα1S before (prebleach), after photobleaching (T = 0, 5, 34 min), and a maximum projection (stack) of T = 30 to 34 min (Right). (G) Mean quantification of the time course of FRAP in WT siblings (thick green line and circles) and stac3−/− (thick red line and circles). Thin lines represent nonlinear regressions from individual traces of FRAPs from WT siblings (green) and stac3−/− (red). The vertical thick green line depicts bleaching. (H) Histogram showing that the diffusion rate (D) of EGFP-DHPRα1S is higher in stac3−/− (t test, ***P < 0.0001, n = 33 stac3−/−, n = 45 WT siblings). SEMs are indicated. (Scale bars, 2 μm.) |
|
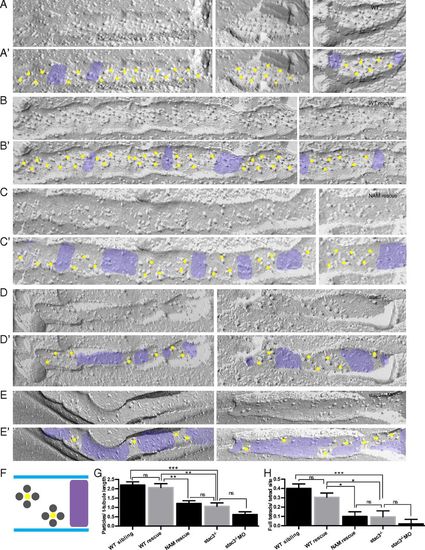
DHPR tetrads are reduced and incomplete in stac3 mutants. (A–E) Freeze-fracture electron micrographs of 4-d postfertilization larvae showing DHPR particles in triadic clusters of WT (A), stac3−/− expressing stac3WT-EGFP (WT rescue) (B), stac3−/− expressing stac3NAM-mKate2 (NAM rescue) (C), stac3−/− (D), and stac3−/− injected with an antisense morpholino oligonucleotide against stac3 (stac3−/− + MO) (E). (A′–E′) Same as A–E, with yellow dots and purple shading added for clarity to denote, respectively, segments of T tubules with tetrad sites of DHPRs and segments of T tubules with no tetrad sites in muscle fibers of WT (A′), WT rescue (B′), NAM rescue (C′), stac3−/− (D′), and stac3−/− + MO (E′). (F) Illustration showing stereotypical DHPR particles in tetrad sites (labeled with yellow dots) along a T tubule and gaps with no tetrad sites (purple) as seen above. (G) Histogram showing that the particles per T-tubule length are decreased in NAM rescue, stac3−/−, and stac3−/− + MO muscles compared with WT and WT rescue. (ANOVA Tukey's; ***P < 0.001, **P < 0.01.) (H) Histogram showing that full tetrads per tetrad site are decreased in NAM rescue, stac3−/−, and stac3−/− + MO muscles compared with WT and WT rescue. ns, not significant. SEMs are indicated. (ANOVA Tukey's; ***P < 0.001, *P < 0.05.) PHENOTYPE:
|
|
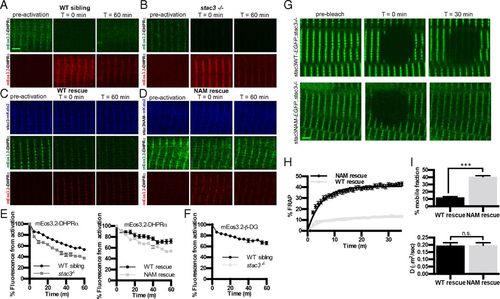
DHPRα is less stable in stac3 mutants. (A and B) Time course for optical pulse-labeling assay of mEos3.2-DHPRα1S expressed in the myofibers of WT sibling (A) and stac3−/− (B). Green channel (Top) and red channel (Bottom) before photoconversion (Left), immediately following photoconversion (Middle), and 60 min after photoconversion (Right). (C and D) Time course for optical pulse-labeling assay of mEos3.2-DHPRα1S in stac3−/− muscles expressing stac3WT-mKate2 (C) or stac3NAM-mKate2 (D). Blue channel representing the far-red mKate2 fluorescence (Top), green channel (Middle), and red channel (Bottom) for mEos3.2-DHPRα1S fluorescence as in A and B. (E) Time course of decay of photoconverted mEos3.2-DHPRα1S shows that fluorescence decays faster in stac3−/− (n = 24) compared with WT siblings (n = 24) (t-permutation test, P < 0.001) (Left) and that photoconverted mEos3.2-DHPRα1S decays faster in myofibers of stac3−/− expressing stac3NAM (n = 20) compared with expressing stac3WT (n = 20) (t-permutation test, P < 0.001) (Right). (F) Time course of decay of photoconverted mEos3.2-β-dystroglycan in WT siblings (n = 9) and stac3−/− (n = 9) shows that fluorescence decays at the same rate in WT and stac3−/− (t-permutation test, P = 0.86). (G) FRAP analysis of stac3−/− myofibers expressing stac3WT-EGFP (Top) or stac3NAM-EGFP (Bottom) before photobleaching (Left), immediately after photobleaching (Middle), and 30 min after photobleaching (Right). (H) Mean time course of FRAP of stac3−/− myofibers expressing stac3WT (n = 18) and stac3NAM (n = 36). (I, Top) Histogram showing the percentage of the mobile fraction is larger in stac3−/− myofibers expressing stac3NAM compared with stac3WT (t test, P < 0.0001). (I, Bottom) Histogram showing that the rate of recovery following photobleaching is unchanged between stac3−/− myofibers expressing stac3WT and stac3NAM (t test, ***P = 0.9). SEMs are indicated. n.s., not significant. (Scale bars, 2 μm.) |

ZFIN is incorporating published figure images and captions as part of an ongoing project. Figures from some publications have not yet been curated, or are not available for display because of copyright restrictions. |

ZFIN is incorporating published figure images and captions as part of an ongoing project. Figures from some publications have not yet been curated, or are not available for display because of copyright restrictions. |
|
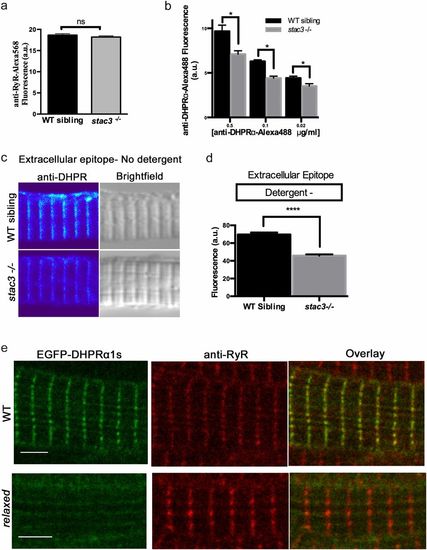
Loss of Stac3 does not prevent trafficking of DHPRα to triads. (A) Quantification of the mean of immunofluorescence labeling (±SEM) of Alexa 568 directly coupled to anti-RyR in stac3−/− at triads compared with WT siblings (n = 60, t test, P = 0.29). (B) Quantification of the mean of immunofluorescence labeling of Alexa 488 directly coupled to anti-DHPRα1S at different concentrations in stac3−/− at triads compared with WT siblings (n = 40 WT sibling, n = 40 stac3−/−, t test, *P < 0.0001). (C) Immunofluorescence (Left) and bright-field images (Right) of WT sibling and stac3−/− disassociated myotubes labeled without detergent with anti-DHPRα1S that recognizes an extracellular epitope. (D) Histogram showing that there is a decrease in T-tubule triadic DHPRα1S in stac3−/− dissociated myotubes (n = 160 WT sibling, n = 125 stac3−/−, t test, ****P < 0.0001). (E) Anti-Ryr immunolabeling of a fixed muscle fiber expressing EGFP-DHPRα1S showing that EGFP-DHPRα1S does not localize to triads in a relaxed mutant fiber, whereas it does in a WT fiber. SEMs are indicated. n.s., not significant. (Scale bars, 4 μm.) |
|
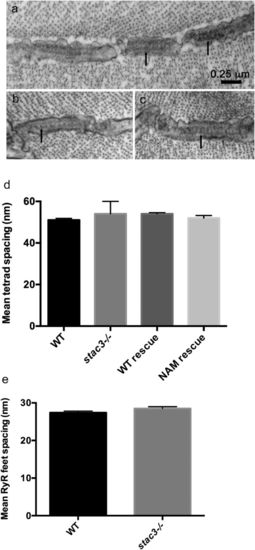
DHPR particles and tetrads are reduced in stac3 mutants but Ryr feet are unaffected. (A) Transverse EM section showing the RyR feet (arrows) at triads in a WT muscle fiber (96 hpf). (B and C) Examples of transverse EM sections showing that the distribution of RyR feet (arrows) in stac3−/− muscles is comparable to that in WT muscles. (D) Histogram showing that the spacing of tetrads was comparable in fibers from WT (n = 39) and stac3−/− (n = 25). stac3−/− expressing Stac3WT (WT rescue, n = 45) and stac3−/− expressing Stac3NAM (NAM rescue, n = 44) larvae (ANOVA, P = 0.07). (E) Histogram showing that the spacing of RyR feet was comparable in WT (n = 27) and stac3−/− (n = 39) fibers (t test, P = 0.11). SEMs are indicated. |

