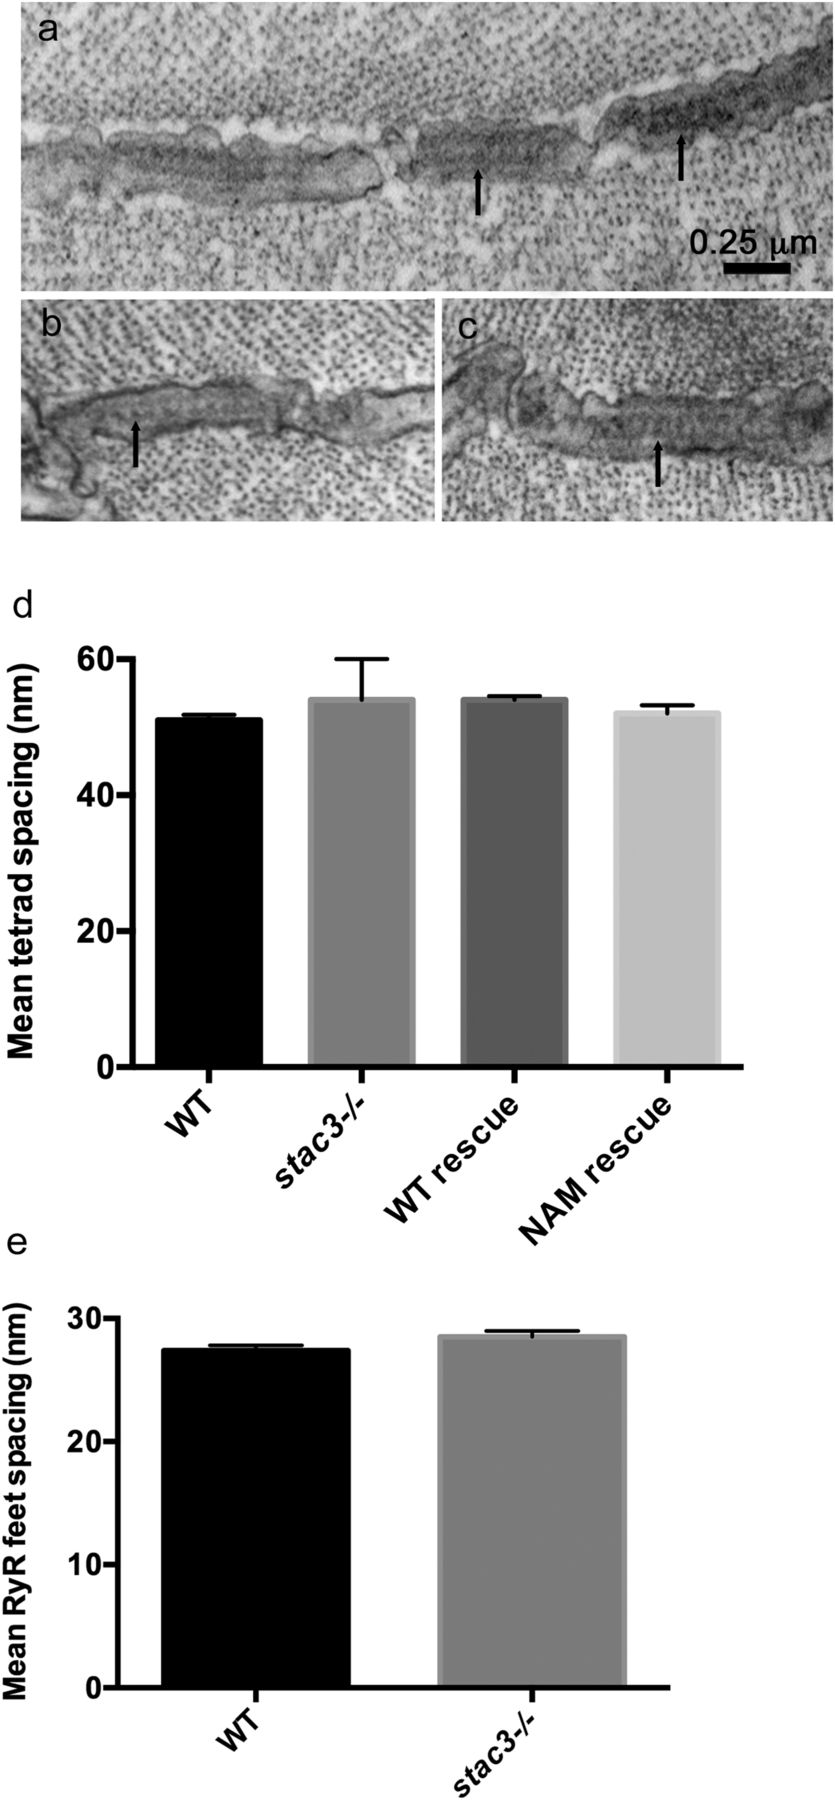
Fig. S4
DHPR particles and tetrads are reduced in stac3 mutants but Ryr feet are unaffected. (A) Transverse EM section showing the RyR feet (arrows) at triads in a WT muscle fiber (96 hpf). (B and C) Examples of transverse EM sections showing that the distribution of RyR feet (arrows) in stac3−/− muscles is comparable to that in WT muscles. (D) Histogram showing that the spacing of tetrads was comparable in fibers from WT (n = 39) and stac3−/− (n = 25). stac3−/− expressing Stac3WT (WT rescue, n = 45) and stac3−/− expressing Stac3NAM (NAM rescue, n = 44) larvae (ANOVA, P = 0.07). (E) Histogram showing that the spacing of RyR feet was comparable in WT (n = 27) and stac3−/− (n = 39) fibers (t test, P = 0.11). SEMs are indicated.

