- Title
-
Maximizing mutagenesis with solubilized CRISPR-Cas9 ribonucleoprotein complexes
- Authors
- Burger, A., Lindsay, H., Felker, A., Hess, C., Anders, C., Chiavacci, E., Zaugg, J., Weber, L.M., Catena, R., Jinek, M., Robinson, M.D., Mosimann, C.
- Source
- Full text @ Development
|
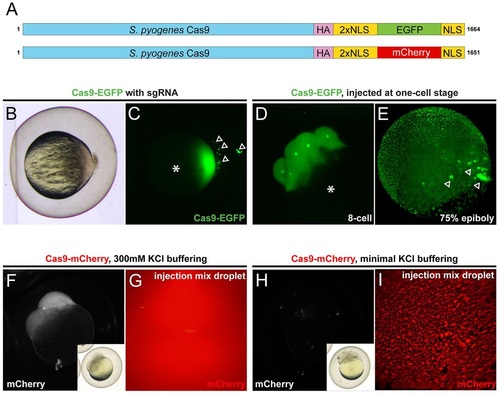
Microinjection of fluorescent Cas9 fusion proteins into zebrafish embryos. (A) Cas9 fusion proteins used in this study, showing the hemagglutinin tag (HA), two nuclear localization signals (NLS), EGFP or mCherry fluorophores, and a third C-terminal NLS. See Fig. S1 for protein sequences. (B,C) One-cell stage zebrafish embryo following microinjection of reconstituted Cas9-GFP-sgRNA complex. Brightfield (B) and EGFP fluorescence (C) reveal precipitated Cas9 complex outside the embryo (arrowheads, C), and strong EGFP fluorescence in the embryo cell without contribution to the yolk cell (asterisk, C). (D,E) Time-course of injected Cas9-EGFP and nuclear localization. Note the even distribution in the developing embryo without yolk fluorescence (asterisk, D) and minimal precipitate inclusions (arrowheads, E). (F-I) Buffering of the Cas9 protein-sgRNA mix with 300mM KCl maintains solubility in the injection mix (F,G) and prevents precipitation before injection (H,I). Insets (F,H) show corresponding brightfield images of fluorescence views. |
|
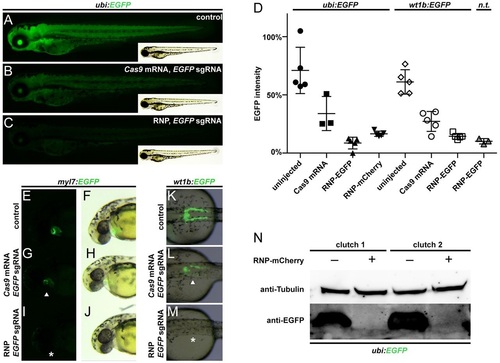
Efficient mutagenesis of EGFP reporter transgenes. (A-C) Mutagenesis of the EGFP open reading frame in transgenic embryos that harbor a single copy of the ubiquitously expressed ubi:EGFP transgene using Cas9 and EGFP sgRNA. (A) 5dpf uninjected heterozygous ubi:EGFP control sibling and (B) embryo following injection of Cas9 mRNA with EGFP sgRNA leads to mosaic EGFP expression, as compared with (C) complete loss of EGFP signal upon Cas9 protein (Cas9p)-sgRNA RNP injection. Insets are brightfield images of fluorescence views. (D) Relative fluorescence quantification of ubi:EGFP and wt1b:EGFP mutagenesis versus RNP-injected non-transgenic (n.t.) controls. Error bars represent mean with s.e.m. (E-J) EGFP mutagenesis in heterozygous myl7:EGFP transgenic reporters that express EGFP specifically in heart muscle cells. Left column depicts EGFP fluorescence, right column shows the brightfield view. (E,F) Control sibling, (G,H) Cas9 mRNA and EGFP sgRNA injection causing mosaic EGFP expression (arrowhead, G), and (I,J) reconstituted Cas9p-sgRNA complex injection results in complete loss of EGFP signal (asterisk, I). (K-M) EGFP mutagenesis in kidney expressing wt1b:EGFP transgenic reporters. Brightfield overlay with EGFP fluorescence. (K) Control sibling, (L) mosaic EGFP expression following Cas9 mRNA and EGFP sgRNA injection (arrowhead), and (M) loss of EGFP following injection of reconstituted Cas9p-sgRNA complex (asterisk). (N) Western blot of EGFP and Tubulin loading control from ubi:EGFP transgenic embryos (two examples are shown) injected with EGFP sgRNA-containing Cas9-mCherry RNPs and control embryos. |
|
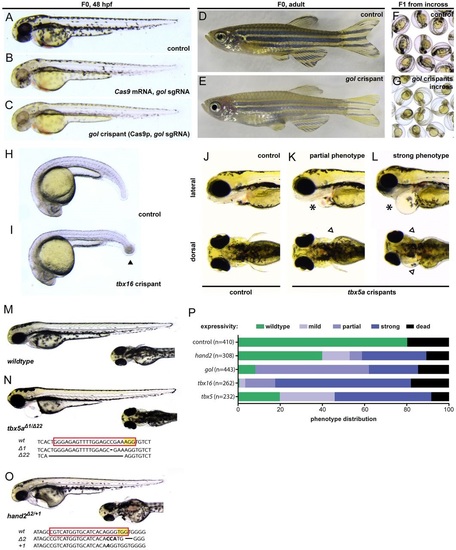
Recapitulation of mutant and morpholino phenotypes in crispants. (A-G) Mutagenesis of golden (gol). (A) wild-type control. (B,C) Targeting with Cas9 mRNA causes mosaic pigment cell phenotypes (B), while solubilized RNP injections can result in zebrafish embryos devoid of wild-type melanocytes (C) that completely mimic the gol mutant phenotype. (D-G) Whereas control siblings develop characteristic pigment patterns as adults (D), fully penetrant gol crispants maintain their mutant phenotype to adulthood (E) and completely transmit mutant gol alleles to the F1 generation when incrossed with other gol crispants (F,G). Adult zebrafish are shown as composite images. F1 phenotypes were assessed from three crispant incrosses resulting in normally sized (75-100) to big (250-300) clutches. (H,I) Crispants for tbx16 can form the characteristic spadetail (spt) phenotype of tbx16 mutants (arrowhead in I, see also Fig. S5K,L). (J-L) Crispants for tbx5a recapitulate the pectoral fin and heart phenotypes of tbx5a mutants and morphants, showing a range of phenotype expressivity including cardiac edema (asterisk, K) and unilateral pectoral fin defects (arrowhead, K), or complete heart tube stretching (asterisk, L) and pectoral fin loss (arrowheads, L). (M-O) Phenotype/genotype correlation of tbx5a and hand2 F2 embryos featuring two different alleles. Red box, target sequence; PAM is in yellow. (P) Phenotype penetrance and expressivity for tested crispants. All embryos summarized in the graph were quality controlled for injection by fluorescence microscopy for the tagged RNP directly after injection; non-fluorescent embryos were discarded; dead embryos were counted at 1dpf and included unfertilized embryos. |
|
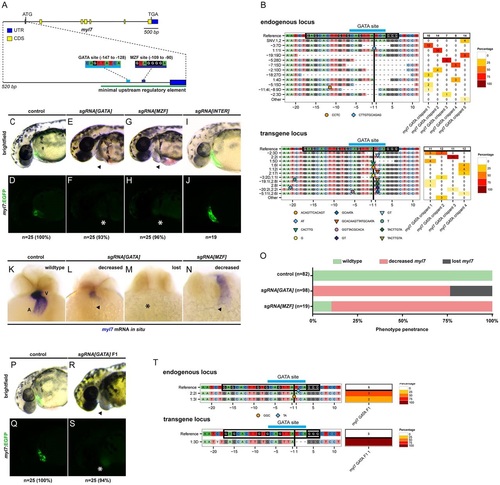
Crispant analysis of transcription factor binding sites upstream of myl7. (A) The zebrafish myl7 locus encoding cardiac myosin light chain 7, with an enlarged depiction of the upstream regulatory region and putative GATA and MZF transcription factor binding sites. (B) Panel plot depicting Cas9-mediated mutagenesis of the GATA site region in individual representative crispants for the endogenous myl7 locus and the single-copy myl7:EGFP transgene. (C-J) Anterior lateral views at 36hpf of heterozygous transgenics for myl7:EGFP targeted with sgRNAs recognizing the GATA or MZF binding site or the interspersed region between the two sites (INTER) in myl7 with solubilized RNPs. (C,D) Control sibling with EGFP expression in the heart tube. (E,F) Reduction or loss of EGFP upon targeting of the GATA site with sgRNA[GATA], (G,H) the MZF site using sgRNA[MZF] or (I,J) the interspersed sequence with sgRNA[INTER]. Arrowheads indicate cardiac edema (E,G); asterisks indicate impaired EGFP signal (F,H). (K-N) mRNA in situ hybridization (ISH) for endogenous myl7 expression at 36hpf in examples of control siblings (K), GATA site crispants (L,M) and MZF site crispants (N). (K) A, atrium; V, ventricle. Arrowheads indicate decreased myl7 expression (L,N); asterisk indicates complete loss of ISH signal (M). (O) Phenotype penetrance and expressivity of myl7 ISH signal in transcription factor site crispants. (P-S) Germline transmission of GATA site mutations. (P,Q) Control myl7:EGFP sibling. (R,S) GATA site germline mutant from crispant incross, featuring cardiac edema (arrowhead, R) and impaired EGFP expression (asterisk, S). (T) Allele sequences of endogenous and hemizygous transgene locus in an F1 embryo, featuring lesions in the predicted GATA site. |
|
Injection of optimally salt-solubilized RNPs into the yolk decreases mutagenesis efficiency to levels suitable for germline transgenesis. (A) Heterozygous ubi:EGFP control embryo. (B) EGFP mutagenesis using Cas9p and EGFP sgRNA injected into the yolk instead of the cell at the one cell-stage; inserts show brightfield image of fluorescent view. (c) Relative EGFP intensity from cell versus yolk injections. |


