FIGURE SUMMARY
Title

Kinocilia mediate mechanosensitivity in developing zebrafish hair cells

Authors
Kindt, K.S., Finch, G., and Nicolson, T.
Source
Full text @ Dev. Cell

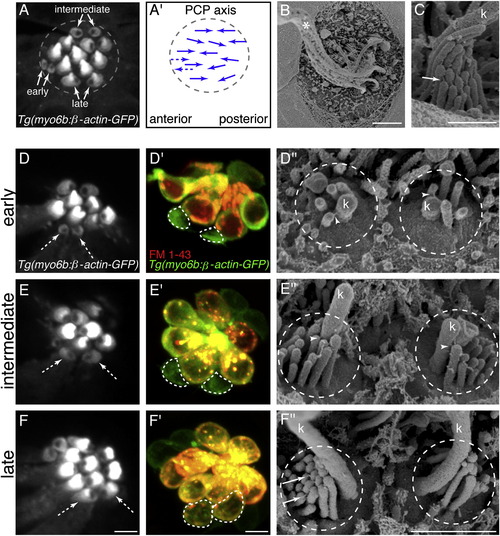
Direct Comparison of Hair-Bundle Development Using Transgenic β-actin-GFP, FM 1-43, and SEM(A) Top-down view of neuromast hair bundles labeled with Tg(myo6b:β-actin-GFP). Three stages of immature hair-bundle development can be observed: early, intermediate, and late. The unlabeled region on either the caudal or rostral side of each bundle is the insertion point of the kinocilium.(A2) Arrows indicate planar polarity and functional polarity of hair bundles in (A). Dashed arrows indicate predicted planar polarity. PCP, planar cell polarity.(B) SEM image of a neuromast at 3 dpf; asterisk denotes the many tall kinocilia (k).(C) SEM image of a mature hair bundle.(D, E, and F) Confocal images of hair bundles expressing β-actin-GFP. White dashed arrows indicate hair bundles of respective stage examined.(D′, E′, and F′) White dashed lines outline cell bodies after FM 1-43 label of hair bundle examined in (D), (E), and (F).(D′′, E′′, and F′′) SEM images of hair bundles in (D), (E), and (F). All images were taken at 3 dpf. White arrowheads denote kinocilial links; solid white arrows denote tip links. Anterior is left; dorsal is up. Scale bars, 2.5 μm (A, B, D, E and F), 500 nm (C), 5 μm (D′, E′, and F′), and 1 μm (D′′, E′′, and F′′). See also Figure S1.

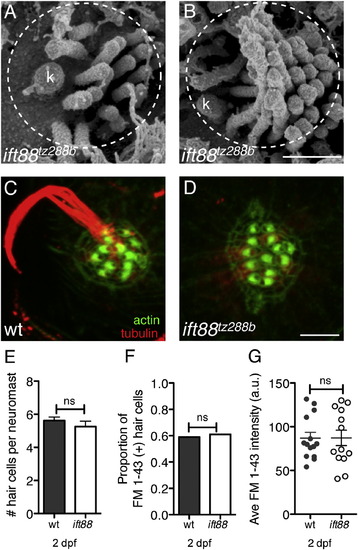
 ovl/ift88 Mutant Hair Cells Lack Kinocilia yet Develop Normally(A and B) SEM image of an ift88tz288b immature (A) and mature (B) hair bundle.(C and D) Tubulin and actin stain of bundles at 5 dpf in wild-type (WT) (C) and ift88tz288b (D).(E) The average number of hair cells per neuromast at 2 dpf in wild-type and ift88tz288b neuromasts (n > 13 neuromasts). ns, not significant.(F) Proportion of FM 1-43-labeled hair cells in ift88tz288b and wild-type neuromasts at 2 dpf (n > 13 neuromasts).(G) The average FM 1-43 intensity per neuromast at 2 dpf (n > 13 neuromasts). a.u., arbitrary units.An unpaired Student’s t test was used to compare number of hair cells per neuromast in (E) and (G). A chi-square Fisher’s exact test was used to compare proportion of FM 1-43-labeled hair cells in (F). Scale bars, 500 nm (A and B) and 5 μm (C and D). Error bars are SEM.

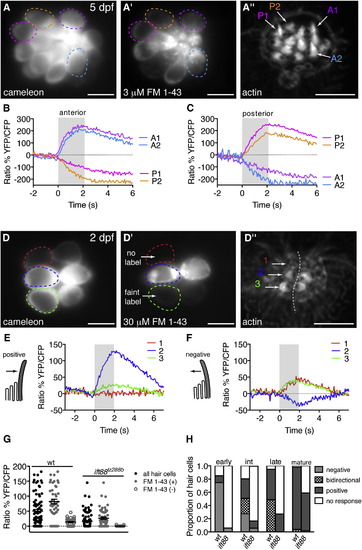
Functional Polarity of Mature and Immature Zebrafish Hair Cells(A) A 5 dpf neuromast expressing cameleon. Circles represent cells analyzed and are color coded and correspond to data in (A′)–(C).(A′ and A′′) FM 1-43 and phalloidin stain of the neuromast in (A). Two anterior-polarized hair bundles (A1 and A2) and two posterior-polarized hair bundles (P1 and P2) are indicated.(B and C) Response of four individual hair cells highlighted in (A) to the same anterior (B) and posterior (C) stimulus.(D–D′′) Same layout as (A)–(A′′) except analysis is at 2 dpf. Hair cell stages are as follows: cell 1, early; cell 2, mature; cell 3, intermediate. (D) A neuromast expressing cameleon. (D′) FM 1-43 strongly labeled a pair of mature cells (cell 2 and sister), faintly labeled a pair of intermediate cells (cell 3 and sister), and yet did not label a pair of early hair cells (cell 1 and sister). (D′′) Phalloidin label of the neuromast in (D)–(D′).(E and F) Mechanically evoked calcium responses corresponding to cells 1–3. Negative and positive deflections are indicated with schematics. Kinocilium is denoted as the tall, gray structure. Cell 1 responded to only negative deflections. Cell 2 responded to positive deflections. Cell 3 responded to both negative and positive deflections.(G) Hair-cell responses (black circles) from wild-type (n = 13 neuromasts) and ift88tz288b (n = 21 neuromasts) at 2 dpf. These same data were broken down into FM 1-43-labeled hair cells (gray circles) and FM 1-43-unlabeled hair cells (open gray circles).(H) Proportion of negative, bidirectional, and positive responses at 2 dpf (n = 188 wild-type and 72 ift88tz288b cells).Errors bars are SEM. Scale bars, 5 µm. For stimulus controls, see also Figure S2.

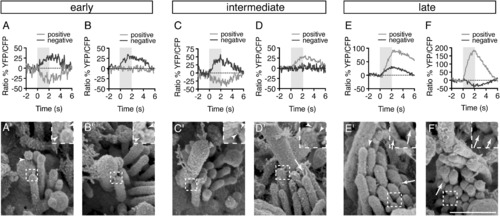
Correlative Calcium Imaging and SEM Reveal a Change in Link Architecture during Development(A–F) Calcium responses were measured in response to positive and negative hair-bundle deflections from cells at each stage of bundle development.(A′–F′) SEM images of the hair bundles from hair cells represented in (A)–(F).All images were taken at 3 dpf. Arrowheads indicate kinocilial links; arrows indicate tip links. Scale bar, 500 nm. Inset is 2× magnification. For additional link examples see also Figure S3.

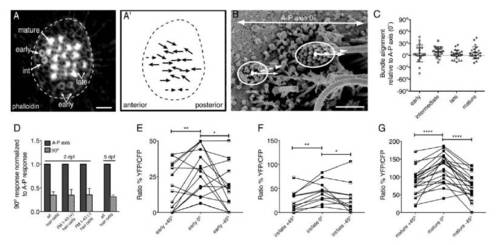
Related to Figure 1. The morphological and functional polarity of neuromast hair bundles is tuned to the A-P axis.
(A) A top down view of a neuromast stained with phalloidin to reveal bundle polarity at 5 dpf. (A′) Solid arrows indicate morphological polarity of each hair bundle in A. Dashed arrows indicate predicted hair-bundle polarity. (B) Method for scoring morphological hair-bundle polarity using SEM. An ellipse was drawn to encompass all stereocilia in each hair bundle. From the center of each ellipse a line was drawn bisecting the kinocilium (dashed line). The angle relative to the A-P axis (solid line) was then calculated. (C) Quantification of hair-bundle polarity using the technique described in (B) for each stage of hair-bundle development; n > 20 hair bundles scored for each stage. (D) In wildtype at 2 dpf, bundle deflection perpendicular to the A-P axis reduced responses similarly in both FM 1-43 labeled and unlabeled hair cells and compared to mature neuromasts at 5 dpf (n = 4 neuromasts per condition). (E, F and G) The calcium response of early, intermediate/late and mature hair bundles stimulated along the A-P axis (0°), and ± 45° off this axis either ventrally or dorsally. An unpaired Student’s t-test found no significant difference comparing any two stages in (C). When normalized to naïve response, a Wilcoxon matched-pairs signed rank test found no significant difference in the reduction between any two populations in (D). A paired Student’s t-test indicated that 45° off the A-P axis, there was a significant reduction in response at all stages in (E, F and G). Error bars in (C and D) represent s.e.m. * P< 0.05; ** P < 0.01; **** P < 0.0001. Scale bar is 5 μm in (A) and 1 μm in (B).

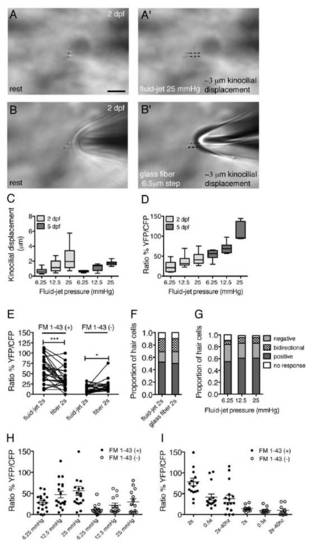
Related to Figure 3. Quantification of the fluid-jet stimulus at 2 dpf and 5 dpf.
(A-B′) Visual confirmation of stimulus delivered to same neuromast at 2 dpf. The measured displacement of kinocilial tips can be visually confirmed using a fluid-jet (A, A′) or a glass fiber (B, B′). Black dashed lines indicate the displacement of kinocilial tips. (C) Average kinocilial displacement per neuromast with increasing water pressure at 2 and 5 dpf (2 dpf n = 17 neuromasts, 5 dpf n = 7 neuromasts). (D) Average calcium response per neuromast for the same stimuli as in (C) (n = 6 neuromasts). (E) Calcium response of individual hair cells at 2 dpf to sustained, 2 s fluid-jet stimulation, compared to a sequential, sustained 2 s glass fiber stimulus (n = 53 hair cells). Both FM 1-43 (+) and FM 1-43 (-) hair cells responded to each type of stimulus, although overall the fluid-jet stimulated hair cells more robustly. (F) Sequential stimulation using a glass fiber and fluid-jet yielded the same proportions of bi-directional, positive and negative responses at 2 dpf (n = 53 hair cells). (G) Proportion of types of responses in hair cells at 2 dpf using three fluid-jet pressures (n = 31 hair cells). (H) At 2 dpf, both FM 1-43 (+) hair cells (solid circles), and FM 1-43 (-) hair cells (open circles) (n = 17 and 14 hair cells respectively) responded to a 2s stimulus at all levels of fluid-jet pressures tested. (I) In addition to a 2 s step, at 2 dpf, FM 1-43 unlabeled hair cells responded to a 0.5 s step and a 2 s, 40 hz square wave (n = 26 hair cells). Error bars in (H and I) represent s.e.m. Whiskers in (C and D) represent 10th and 90th percentile. Scale bar in (A) is 5 μm. * P < 0.05, *** P < 0.001.

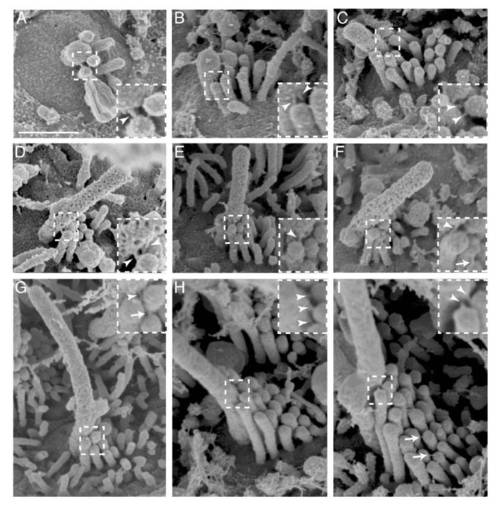
Related to Figure 5. Kinocilial links are present at all stages of hair bundle development. (A-I) SEM images of early (A and B), intermediate (C, D, E and F), late (G and H) late and mature (I) hair bundles. Arrowheads indicate kinocilial links, while arrows indicate tip links. Scale bar is 500 nm, inset is 2X magnification

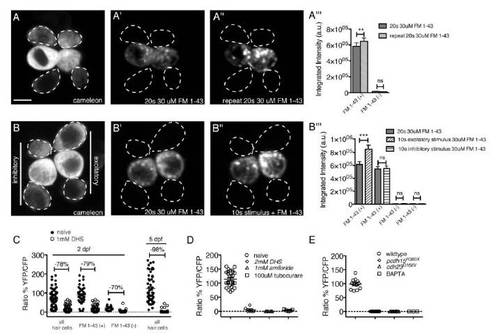
Related to Figure 6. FM 1-43 does not label all mechanosensitive hair cells at 2 dpf.
(A, A′, A′′ and A′′′) Fluorescent image of a neuromast expressing cameleon (A), after a 20 s incubation with 30 μM FM 1-43 (A′), and after an additional 20 s incubation with 30 μM FM1-43 (A′′). While this additional FM 1-43 application labeled FM 1-43 (+) hair cells more intensely, more hair cells were not labeled. This data is quantified in (A′′′) (n = 48 FM 1-43 (+), and 30 FM 1-43 (-) hair cells). (B, B′, B′′ and B′′′) A fluorescent image of a neuromast expressing cameleon (B), after 20 s with 30 μM FM 1-43 (B′), and after anterior (right side of neuromast) hair bundles were deflected in the excitatory direction in the presence of 30 μM FM 1-43 for 10 s (B′′). (B′′′) No additional hair cells were labeled (n = 15 FM 1-43 (-) hair cells). FM 1-43 (+) hair cells excited by the stimulus (n = 28) were labeled more intensely, whereas hair cells receiving an inhibitory stimulus were not (n = 28). (C) The response of hair cells at 2 dpf or 5 dpf to a 2 s stimulus (solid circles) and after bath application of 1 mM DHS (open circles; 2 dpf: n = 58 hair cells; 5 dpf: n = 50 hair cells). These data were split into FM 1-43 (+) and FM 1-43 (-) populations and replotted. The percentage reduction in the mean is shown for each group. (D) Mechanotransduction blockers DHS, amiloride and curare significantly (P > 0.001) blocked hair-cell calcium responses (n > 5 neuromasts per treatment). (E) Hair cells deficient in tip-link components Cdh23 or Pcdh15 did not respond to deflection. BAPTA treatment to remove tip links also abolished all responses (n > 12 neuromast per genotype or treatment). Dashed lines indicate hair cells that failed to label with FM 1-43. A paired Student’s t-test was used to compare changes in intensity in (A′′′ and B′′′) and calcium responses in (D and E). When normalized to naïve response, a Wilcoxon matched-pairs signed rank test found no significant difference in the reduction between dye labeled (solid circles), and or unlabeled (open circles) hair cell populations at 2 dpf in (C). Error bars in A′′′, B′′′, C and E represent s.e.m. ** P < 0.01, *** P < 0.001. The scale bar in (A) is 5 μm.

Acknowledgments
This image is the copyrighted work of the attributed author or publisher, and ZFIN has permission only to display this image to its users. Additional permissions should be obtained from the applicable author or publisher of the image.

Reprinted from Developmental Cell, 23(2), Kindt, K.S., Finch, G., and Nicolson, T., Kinocilia mediate mechanosensitivity in developing zebrafish hair cells, 329-341, Copyright (2012) with permission from Elsevier. Full text @ Dev. Cell