- Title
-
Histone deacetylase-4 is required during early cranial neural crest development for generation of the zebrafish palatal skeleton
- Authors
- Delaurier, A., Nakamura, Y., Braasch, I., Khanna, V., Kato, H., Wakitani, S., Postlethwait, J.H., and Kimmel, C.B.
- Source
- Full text @ BMC Dev. Biol.
|
Identification of zebrafish Hdac4 and characterization of mRNA expression in the developing head. (A) Zebrafish Hdac4 protein contains functional domains conserved with human HDAC4, including nuclear localization (NLS), nuclear export (NES), and phosphorylation (S) sites [22-24, 26]. (B-J) mRNA in situ hybridizations, anterior is to the left, dorsal is up. Images are projections from confocal stacks taken from the left side of the embryo. (L and M) Images are projections from confocal stacks of dissected flat-mounts, ventral side facing upwards. (B) hdac4 mRNA is expressed throughout the head at 15 hpf, with expression posterior (p) and dorsal (d) to the eye. Transcript for hdac4 is also expressed medial to the eye (m). (C) pdgfra mRNA expression at 15 hpf, posterior to the eye (p), dorsal to the eye (d), and medial to the eye (m). (D) hdac4 and pdgfra are co-expressed at 15 hpf. (E-G) hdac4 and pdgfra mRNAs are co-expressed at 17 hpf in three streams of expression, including dorsal to the eye (d), posterior to the eye (p), and medial to the eye (m). (H) At 72 hpf, hdac4 mRNA is expressed throughout the pharyngeal arches (a1, a2, a3-6) and the pectoral fin. (I) sox9 mRNA is expressed in developing cartilage (arch 1 (a1) derivatives pseudocolored in tan, arch 2 (a2) magenta, and arches 3–6 (a3-6) blue). (J) hdac4 mRNA is co-expressed with sox9 in some regions of arch 1 and 2 cartilages (indicated by white arrows), but primarily surrounds sox9-expressing chondrocytes in arches 3–6. (K) Schematic of ventral view of dissected embryo at 72hpf showing the ethmoid plate (ep) and trabeculae (tb) of the palatal skeleton, and pharyngeal cavity (pc). (L and M) hdac4 mRNA is expressed in the ethmoid plate and trabeculae of the palatal skeleton. (M) sox9 is expressed in the ethmoid plate. B-G: scale bar = 50 μm, H-J: scale bar = 200 μm, L and M: scale bar = 50 μm. EXPRESSION / LABELING:
|
|
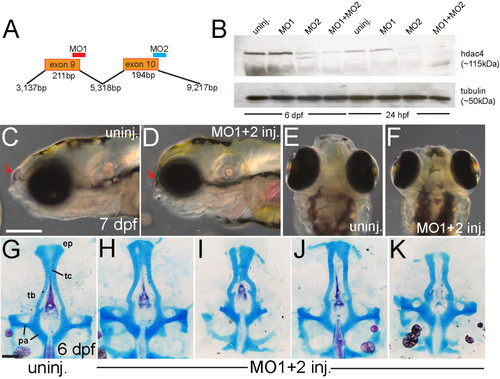
Morpholino-knockdown ofhdac4results in facial shortening and defects in palatal skeleton cartilage. (A) Splice-blocking morpholinos MO1 and MO2 target exon-9 and exon-10 of hdac4 mRNA. (B) Western blot shows down-regulation of Hdac4 protein in extracts of MO-injected embryos and larvae at 24 hpf and 6 dpf. Co-injection of MO1 (12 mg/ml) + MO2 (2 mg/ml) showed greater down-regulation of protein levels than injection of either MO alone. (C-F) Whole-mount images of living embryos at 7 dpf. C and D are lateral views with anterior towards the left and dorsal upwards, E and F are dorsal views with anterior upwards and dorsal is facing. (C and E) In uninjected fish, the face projects anterior to the eyes (indicated by red arrow in C). (D and E) The anterior projection of the face is lacking in MO-injected fish (indicated by red arrows in C and D). (G-K) Ventral view of Alcian Blue (cartilage) and Alizarin Red (bone) stained palatal skeletons, flat-mounted at 6 dpf. Anterior is upwards. (G) Uninjected fish have a normal palatal skeleton with trabeculae (tb), an ethmoid plate (ep), trabeculae communis (tc), and parachordal cartilage (pa). (H-J) MO-injected fish have a variety of palatal skeletal defects including shortened or narrowing of the ethmoid plate (H-K), holes in the ethmoid plate (H), clefts (I and K), and weak or absent trabeculae communii (H-K). C-F: scale bar = 250 μm, G-K: scale bar = 100 μm. |
|
Over-expression ofhdac4mRNA rescues palatal defects associated with MO-injection and causes midline craniofacial defects. (A-D) Alcian Blue (cartilage) and Alizarin Red (bone) stained embryos and dissected palatal skeletons. (A and B) Ventral view of whole-mount skeletal preparations of 6 dpf larvae, anterior is upwards, ventral is facing. (C and D) Flat-mounts of palatal skeletons at 6 dpf. Anterior is upwards. (A) Uninjected fish have normal development of craniofacial cartilage and bone. (B) hdac4 mRNA injection resulted in cyclopia and a loss of normal midline patterning (indicated by white arrow). (C) Uninjected fish have normal palatal skeletons. (D) hdac4 mRNA injection results in ‘stick’-like palatal skeletons. (E) Co-injection of hdac4 mRNA (20 ng/µl) and MO1 + 2 (12 + 2 mg/ml) resulted in protein levels similar to levels in uninjected embryos 24 hours post-injection, compared with injection of mRNA or MOs alone. (F) Embryos used for the protein assay were also raised to 6 dpf and scored for palatal phenotypes. Co-injection of hdac4 mRNA with MO1 + 2 resulted in a decrease of MO-like defects (i.e. cleft, hole, ethmoid plate (EP) defects) compared with MO-injection alone. A and B, scale bar = 200 μm; C and D, scale bar = 100 μm. |
|
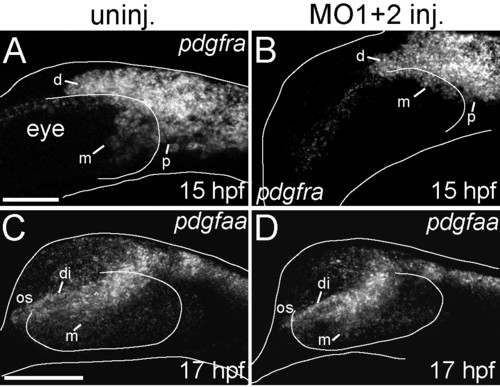
pdgframRNA expression is down-regulated inhdac4MO-injected embryos, although the ligandpdgfaais unaffected. (A-D) mRNA in situ hybridizations, lateral views where anterior is towards the left, dorsal is upwards, Images are projections from confocal stacks. Dorsal and ventral margins and the eye margin of the embryo were outlined from brightfield images. (A) Uninjected embryos showed expression of pdgfra dorsal to the eye (d), posterior to the eye (p), and medial to the eye (m) at 15 hpf. (B) MO-injected embryos showed more limited expression of pdgfra, in particular loss of pdgfra expression medial to the eye (m) at 15 hpf (compare m in A with B). (C) At 17 hpf, uninjected embryos showed pdgfaa mRNA expression in the diencephalon (di), medial to the eye (m), and in the optic stalk anterior to the eye (os). (D) At 17 hpf, hdac4 MO-injected embryos had similar patterns of pdgfaa mRNA expression in the diencephalon (di), medial to the eye (m), and in the optic stalk (os). A and B, scale bar = 50 μm, C-D scale bar = 100 μm. EXPRESSION / LABELING:
|
|
Migratory cranial neural crest cell populations medial to the eye are reduced in MO-injected embryos. (A-D) Live sox10:EGFP transgenic embryos imaged at 14 hpf (A, C) and 16 hpf (B, D). (A-E) Lateral views: anterior is towards the left dorsal is upwards. (A and B) Uninjected embryos (n = 6) showed migration of GFP-positive neural crest cells medial to the eye (m) starting at 14 hpf. By 16 hpf (B), cells migrated anteriorly and ventrally. (C and D) hdac4 MO-injected embryos (n = 6) showed a reduction of GFP-positive cells medial to the eye (m). (E) Measurement of the maximum length of the migratory trajectories of GFP-postive cells medial and dorsal to the eye (blue line and red line, respectively). Measurements were made on fixed uninjected and MO-injected sox10:EGFP transgenic embryos at 14 hpf (uninjected n = 23, injected n = 15) and 16 hpf (uninjected n = 17, injected n = 19). (G) The absolute distance from the posterior region of the eye to the frontier of GFP-positive cells medial to the eye in MO-injected fish was significantly shorter than in uninjected controls at both 14 and 16 hpf (p < 0.001). (H) The absolute distance to the frontier of GFP-positive cells dorsal to the eye was significantly longer in uninjected controls compared to the distance in MO-injected fish at 14 hpf (p < 0.001), but not at 16 hpf. (I) The relative percentage difference of medial vs. dorsal cell migration was not significant between MO-injected embryos and uninjected controls at 14 hpf, but becomes significant at 16 hpf (p < 0.001), indicating that while dorsal cell migration is not affected by MO-injection, medial cell migration is specifically affected. A-E: scale bar = 100 μm. G-I: error bars = SEM. NS = not significant. EXPRESSION / LABELING:
PHENOTYPE:
|
|
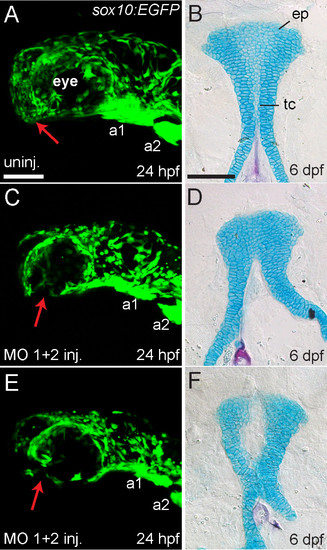
Reduction or absence of neural crest cells in MO-injected embryos is associated with palatal defects. (A,C, E) Lateral views of live sox10:EGFP transgenic embryos at 24 hpf. Anterior is towards the left, dorsal is upwards. (B,D,F) Ventral view of Alcian Blue (cartilage) and Alizarin Red (bone) stained palatal skeletons of the same individual fish shown in A,C,E, fixed and flat-mounted at 6 dpf. Anterior is upwards. (A) Uninjected embryos (n = 7) showed GFP expression in neural crest-derived tissues in the head including arch 1 (a1) and arch 2 (a2), and GFP-positive cells populate the anterior-ventral margin of the face where the palatal skeleton forms (indicated by red arrow). (B) Uninjected embryos had normal development of the ethmoid plate (ep) and trabeculae communis (tc) of the palatal skeletons. (C and E) hdac4 MO-injected embryos (n = 6) showed GFP expression in neural crest-derived tissues in the head, including arch 1 (a1) and arch 2 (a2), but a lack of cells in the anterior-ventral margin of the face at 24 hpf (indicated by red arrows) (D and F) The same hdac4 MO-injected embryos in C and E had palatal skeleton defects at 6 dpf (n = 6/6), including defects in formation of the trabeculae communis (D), and ethmoid plate (F). A,C,E scale bars = 100 μm, B,D,F scale bar = 100 μm. |
|
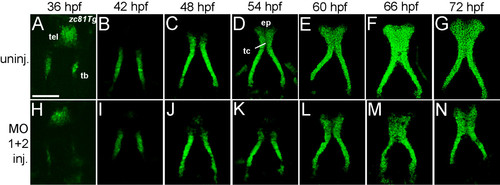
Trabecular growth and formation of the ethmoid plate is defective inhdac4MO-injected embryos. (A-N) Ventral views of zc81Tg transgenic embryos and larvae from uninjected (n = 3, each stage) and MO-injected (n = 3, each stage) fish. Palatal skeletons were dissected and flat-mounted. Images are projections from confocal stacks. Anterior is facing upwards. (A-G) Uninjected fish show stages of normal development of the palatal skeleton. (A) Trabeculae (tb) are first detected at 36 hpf as clusters of cells. At this stage, the head is bent forward and GFP expression is visible in a region anterior to the telencephalon (tel). (B) By 42 hpf, the trabeculae are elongated. (C) At 48 hpf, the anterior margin of the trabeculae converge. (D) At 54 hpf, the trabeculae communis forms (tc), and cells fill in the ethmoid plate (ep). (E-G) Between 60–72 hpf, the ethmoid plate widens (E) and fills in with GFP-positive cells (F). (H-N) MO-injected fish show defects in palatal skeleton formation. (H and I) Between 36 and 42 hpf trabeculae are smaller than those in uninjected fish at the same stage (H). (J and K) Trabeculae converge anteriorly, but the trabeculae communis fails to form. (L-N) Between 60–72 hpf, the trabeculae communis is formed weakly (L), the ethmoid plate fails to fill in with GFP-positive cells (M and N), and there is a lack of anterior growth and holes in the palatal skeleton (M and N). Scale bar = 100 μm. EXPRESSION / LABELING:
PHENOTYPE:
|
|
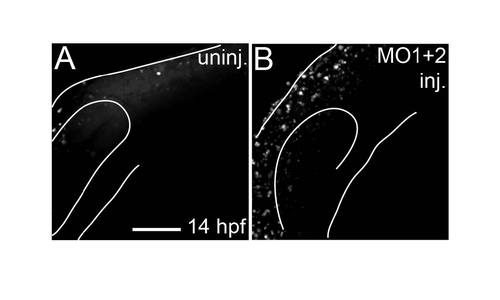
bCell death is not increased in MO-injected embryos in regions where medially-migrating CNC cells are present. (A and B) Live embryos stained with AO and imaged at 14 hpf. Lateral views: anterior is towards the left dorsal is upwards. Images are projections from confocal stacks. MO-injected embryos had overall higher levels of AO staining throughout the head compared to uninjected controls. MO-injected embryos did not show any localized increase in labeled degenerating cells in regions of the head populated by CNC cells fated to migrate medial to the eye and subsequently form the ethmoid plate. Scale bar = 100 μm. |
|
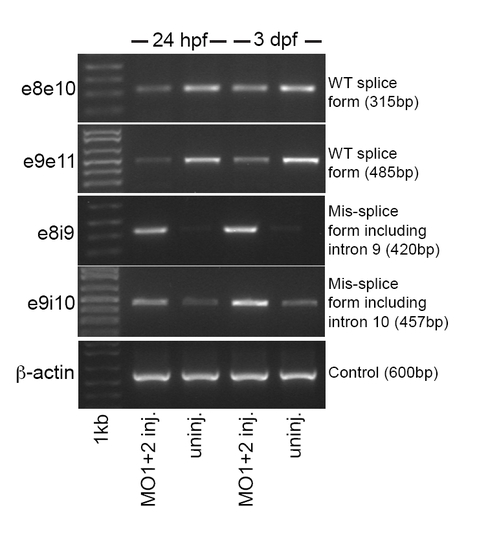
hdac4 mRNA splicing is down-regulated in MO-injected embryos. RT-PCR of cDNA from whole embryo RNA extractions at 24 hpf and 3 dpf. Combined injection of MO1 and MO2 resulted in down-regulation of normal splicing between exon-8 and exon-9 and exon-9 and exon-10 (e8e10 = PCR product showing splicing between exon-8 through exon-10 splicing; e9e11 = PCR product showing splicing between exon-9 through exon-11; e8i9 = PCR product showing mis-splicing resulting in inclusion of intron between exon-8 and intron-9; e9i10 = PCR product showing mis-splicing resulting in inclusion of intron between exon-9 and intron-10). The expression of mRNA with intronic sequence was higher in injected embryos than in uninjected controls. RT-PCR for β-actin (control) was performed to demonstrate total mRNA levels used for RT-PCR were equal between samples. EXPRESSION / LABELING:
|


