- Title
-
Live Imaging of Tumor Initiation in Zebrafish Larvae Reveals a Trophic Role for Leukocyte-Derived PGE(2)
- Authors
- Feng, Y., Renshaw, S., and Martin, P.
- Source
- Full text @ Curr. Biol.
|
Blocking COX-2-mPGES-Mediated PGE2 Production Suppresses the Growth of V12RAS+ Transformed Cells In Vivo(A) A schematic representation of PGE2 production through the COX-2 pathway indicates the targets and inhibitors used in this study.(B) A schematic representation of our pharmacological treatment regime and clonal analysis of transformed cells (green) in V12RAS+-cell-bearing larvae. A yellow box indicates the flank skin region in which we quantified alterations in growth of V12RAS+ cells.(C–G) Graphic comparisons of V12RAS+ cell numbers in larval flank skin region after various treatments; (C) larvae treated with DMSO, COX-1 inhibitor, SC-560, and the COX-2 inhibitors NS398 and Celecoxib (p < 0.01, n = 22, 27, and 32, respectively); (D) larvae treated with DMSO, NS398, and NS398 +dmPGE2 (p < 0.001, n = 56, 51, and 40, respectively); (E) larvae treated with DMSO, Celecoxib, and Celecoxib +dmPGE2 (p < 0.001, n = 61, 42, and 42, respectively); (F) larvae treated with DMSO, CAY10560 and CAY10560 +dmPGE2 (p < 0.001, n = 45, 42, and 46, respectively); (G) Control morphants, mPGES morphants, and mPGES morphants rescued with dmPGE2 (p < 0.001, n = 26, 25, and 25, respectively).(H) Immunostaining for COX-2 (blue) indicates that both leukocytes (anti-L-plastin [red]) and V12RASeGFP+ transformed cells (green) express COX-2.(I) Single-channel image of (H), better showing COX-2 expression; green and red arrows indicate transformed cells and leukocytes, respectively.(J) Immunostaining for mPGES (blue) indicates its expression by some leukocytes (anti-L-plastin; red arrow) but not transformed cells (green).(K) Single-channel image of (J).(L–N) Representative images of flank skin regions showing V12RAS+ clones (green) of (L) control morphant, (M) mPGES morphant, and (N) mPGES morphant supplemented with dmPGE2- Scale bars represent 20 μm (H and I), 15 μm (J and K), and 100 μm (L–N). See also Figures S1, S2, and S3. |
|
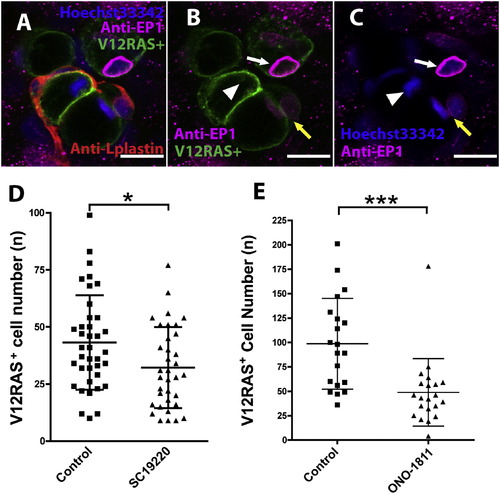
PGE2 Promotes Growth of Transformed Cells via the EP1 Receptor(A–C) Immunostaining for EP1 receptor showing EP1 (magenta) localized within V12RASeGFP+ cells (green); nuclei are stained with Hoechst 33342 (blue), and leukocytes are revealed by immunostaining with anti-L-plastin antibody (red). EP1 receptor (magenta) shows perinuclear localization (white arrows in [B] and [C]); a pair of recently divided daughter transformed cells exhibit faint EP1 staining (yellow arrows in [B] and [C]), and a transformed cell at metaphase shows no EP1 signal (white arrowhead in [C]). Scale bars represent 10 μm.(D) Graphic illustration showing that EP1 receptor antagonist SC19220 leads to a reduction in the number of transformed cells (p < 0.05, n = 38 and 35).(E) The same is true for the EP1 receptor antagonist ONO-1811 (p < 0,001, n = 20 and 21).See also Figure S1. EXPRESSION / LABELING:
|
|
Leukocyte Depletion Prevents V12RAS+ Cell Growth, which Can Be Partially Rescued by dmPGE2(A–I) Representative images of flank skin regions illustrating numbers of V12RASeGFP+ transformed cells after morpholino (Mo) knockdown of pu.1 and gcsfr (for depletion of both neutrophils and macrophages); gcsfr alone (for depletion of neutrophils); irf8 or a lower dose (2 nl/embryo) of pu.1 morpholino alone (for depletion of macrophages) with or without additional treatment with dmPGE2.(J) Graphic illustration of how dmPGE2 can rescue the number of transformed cells in morphants in which both neutrophils and macrophages have been specifically depleted (p < 0.01, n = 33, 32, and 34).(K) Graphic illustration of how dmPGE2 can only partially rescue morpholino knockdowns that largely target neutrophils (p < 0.001, n = 25, 25, and 22).(L and M) Similar graphic illustration of how dmPGE2 can rescue morpholino knockdowns that largely target macrophages (irf8 Mo-p < 0.05, n = 24, 26, and 23; 2 nl pu.1 Mo-p < 0.05, n = 31, 30, and 34).The scale bar represents 100 µm. See also Figures S3 and S4. PHENOTYPE:
|
|
Live Imaging Reveals that Reduced PGE2 Levels as a Result of COX-2 Inhibition Lead to Leukocyte Behavior Change and Increased Transformed-Cell Death(A and B) Still images from movies illustrating neutrophil (red) numbers and their motility in the vicinity of V12RAS transformed cells (green) in (A) control and (B) NS398-treated larvae (images are taken from Movie S1) (A′ and B′) show the tracks over 100 min of neutrophil movements from the two movies S1A and S1B, respectively, revealing reduced neutrophil motility in NS398-treated (B2) compared with control (A′) larva. Scale bars represent 50 μm.(C) Quantification of neutrophil migration velocity (V = mean ± SD); DMSO-treated V = 0.125 ± 0.046 μm (n = 39); NS398-treated V = 0.054 ± 0.038 μm (n = 32).(D) A series of still images from a time-lapse movie (see Movie S2) showing transformed-cell death associated with a macrophage encounter in a larva treated with NS398; subsequently, this macrophage and others engulf the resulting cell debris. Red arrows in (i)–(iv) indicate a macrophage labeled by NFκB-RE:eGFP (pale green). Purple arrow in (v) indicates a macrophage engulfing the transformed-cell debris and forming a phagosome inside its cell body. The scale bar represents 15 μm. |
|
Chemical treatments do not affect endogenous kit-a expression or larval development (related to Figures 1 and 2). (A) q-PCR data for kit-a expression by chemical-treated larvae confirming that these chemical treatments do not alter transgene expression level. (B-I) Wide field images of chemical-treated larvae at 4dpf, showing that our various chemical treatments does not result in any obvious developmental abnormalities. (J-S) Representative images of flank skin regions showing V12RAS+ clones (green) of (J) DMSO, (K) NS398, (L) Celecoxib, (M) CAY10560, (N) SC19220, (O) SC-560, (P) NS398+dmPGE2 (Q) Celecoxib+dmPGE2, (R) CAY10560+dmPGE2, (S) ONO-1811. Scale bars in J-S = 100μm. |
|
Schematic to illustrate mPGES morpholino experiment + larval images to show the normal development of treated larvae (related to Figure 1). (A) Schematic outline of our procedure for morpholino knockdown of mPGES expression in zebrafish larvae. In both treated groups the medium was supplemented with stable PGE2 (dmPGE2) to compensate for the PGE2 required for normal development up to 42hpf; subsequently, dmPGE2 was removed from the PGE2 suppressed group. (B-D) Wide field images of the morphologies of Control morphant (B), mPGES Morphant with dmPGE2 rescued until 48hpf (C), and mPGES Morphant larvae with dmPGE2 rescued until 4.5dpf (D). |
|
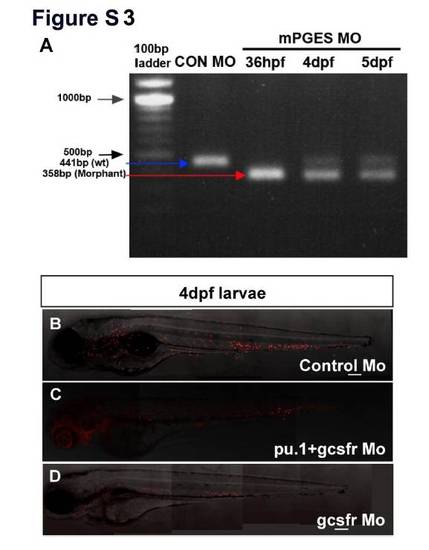
Morpholinos are still effective throughout the timecourse of our transformed cell number analysis (related to Figures 1 and 3) (A) RT-PCR results showing that mPGES morpholino is still capable of significant knockdown of wild type mPGES mRNA until at least 5dpf. (B-E) Wide field images overlayed with red fluorescent views of Tg (lysC:DsRed) larvae, showing neutrophils still suppressed in pu.1+gcsfr Morpholino and gcsfr Morpholino injected larvae at 4.5dpf. Scale bar=150μm. PHENOTYPE:
|
|
Normal morphology of leukocyte-depleted morphants (related to Figure 3) (A-G) Wide field images of morphants showing no general morphological defects; (H-N) Confocal images of anti-L-plastin immunostaining (magenta) of Lys:DsRed+ (green) larvae, showing no increase of L-plastin+ cells (magenta) or LysC:DsRed+ cells (green) in dmPGE2 treated, pu1+gcsfr morphants (L), irf8 morphant (M) or gcsfr morphants (N), when compared with untreated equivalent morphants (I, J, K respectively). Scale bar=100μm. |


