- Title
-
miR-221 Is Required for Endothelial Tip Cell Behaviors during Vascular Development
- Authors
- Nicoli, S., Knyphausen, C.P., Zhu, L.J., Lakshmanan, A., and Lawson, N.D.
- Source
- Full text @ Dev. Cell
|
miR-221 Is Required for Vascular Development (A) Whole-mount in situ hybridization of embryos at 48 hr postfertilization (hpf). Dorsal aorta and posterior cardinal vein are indicated by a bracket and A or V, respectively. Arrows indicate intersegmental blood vessels (ISV). Scale bar = 50 μm. (B) Left column, transmitted light images of embryos at 30 hpf injected with indicated MO. Scale bar = 250 μm. Right column, confocal micrographs of trunk vessels at 30 hpf in Tg(kdrl:egfp)la116 embryos injected with indicated MO. ISVs indicated by arrows and DLAV by arrowheads. Scale bar = 50 μm. (C) Tg(kdrl:egfp)la116 embryos at 27 hpf injected with 10 ng control or miR-221 MO. aa1, aortic arch 1; PHBC, primordial hindbrain channel; LDA, lateral dorsal aorta. Scale bar = 50 μm. (D) Tg(fli1a:egfp)y1 embryos at 5 days postfertilization (dpf) injected as in (C). DA, dorsal aorta; PCV, posterior cardinal vein; position of thoracic duct is indicated by arrows. Scale bar = 25 μm. (E) Transmitted light images of larvae at 5 dpf injected as in (C). Scale bar = 500 μm. All panels are lateral views, dorsal is up, anterior to the left. |
|
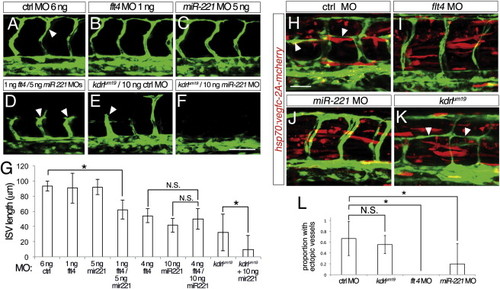
miR-221 Is Required for Vegfc/Flt4 Signaling (A–F) Confocal micrographs Tg(fli1a:egfp)y1 embryos at 27 hpf; arrowheads denote ISVs; lateral views, dorsal is up, anterior to the left. (A) Embryo injected with 6 ng control MO. (B) Embryo injected with 1 ng flt4 and 5 ng control MO. (C) Embryo injected with 1 ng control and 5 ng miR-221 MO. (D) Embryo injected with 1 ng flt4 MO and 5 ng miR-221 MO. (E) kdrlum19 mutant embryo injected with 10 ng control MO. (F) kdrlum19 mutant embryo injected with 10 ng of miR-221 MO. (G) Quantification of ISV length in wild-type or kdrlum19 mutant embryos injected with indicated MOs. Measurements were made of four adjacent ISVs per embryo in at least 18 embryos from three separate injections; -p < 0.001; N.S., not statistically different. (H–K) Tg(fli1a:egfp)y1 embryos injected with hsp70:vegfc-2A-mcherry transposable element and heat shocked at 15 ss. Red indicates Vegfc-2A-mcherry expression. Arrowheads indicate ectopic formation of vessels. Embryos at 33 hpf coinjected with (H) 10 ng control MO, (I) 2 ng flt4 MO, (J) 10 ng miR-221 MO, or (K) mutant for kdrlum19. (L) Proportion of hemisegments with ectopic vessel sprouts in embryos injected with 25 pg Tol2-hsp70:vegfc-2A-mcherry and 25 pg Tol2 transposase. Embryos were co-injected with indicated MO, or were mutant for the kdrlum19 allele as determined by genotyping following phenotypic analysis. -p < 0.02; N.S., not significant. Scale bars are (A–F) 50 µm and (H–K) 25 μm. |
|
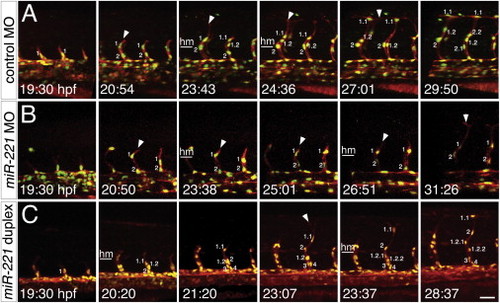
miR-221 Regulates Migration and Proliferation of Tip Cells (A–C) Still images from time-lapse analysis of (A and B) Tg(fli1a:negfp)y7;(kdrl:ras-cherry)s916 or Tg(fli1a:negfp)y7;(kdrl:tagrfap-caax)is19 embryos. Time (hpf) is noted in the bottom left hand corner. Nuclei are numbered; successive numbers indicate new cells that migrated from the dorsal aorta, decimals indicate daughter cells arising from cell division. Lateral views, dorsal is up, anterior to the left. Horizontal white line denotes horizontal myoseptum (hm). (A) Embryo injected with 10 ng control MO. (B) Embryo injected with 10 ng miR-221 MO. (C) Embryo injected with 500 µM miR-221 duplex. Scale bar is 25 μm. See mmc3VIDEO, mmc4VIDEO and mmc5VIDEO. PHENOTYPE:
|
|
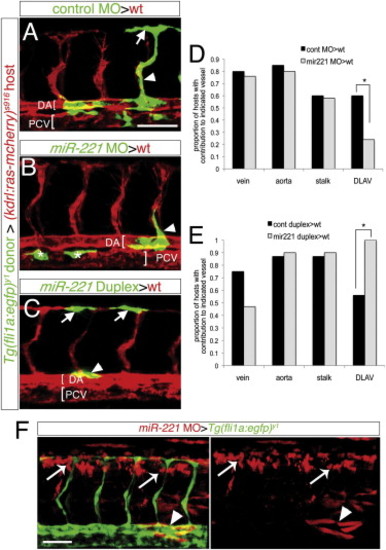
miR-221 Acts Endothelial Cell Autonomously to Drive Tip Cell Potential (A–C and F) Confocal micrographs of mosaic embryos at 27 hpf following cell transplantation. (A–C) Donor Tg(fli1a:egfp)y1 cells are green, host Tg(kdrl:ras-mcherry)s916 vessels are red; DA, dorsal aorta; PCV, posterior cardinal vein, both indicated by brackets. (A) Donor control cells in DLAV (arrow) and ISV stalk (arrowhead). (B) Donor miR-221-deficient cells in the ISV stalk (arrowhead). Asterisks indicate donor cells in the PCV. (C) Donor cells overexpressing miR-221 in DLAV (arrows) and dorsal aorta (arrowhead). (D and E) Proportion of host embryos with donor contribution to indicated blood vessel type. (D) -p = 0.04. (E) -p = 0.001. (F) Tg(fli1a:egfp)y1 host embryo with miR-221-deficient donor cells labeled with rhodamine in nonendothelial cell types surrounding the ISVs, including neural tube (white arrows) and somites (white arrowheads). Scale bars are 50 μm. EXPRESSION / LABELING:
|
|
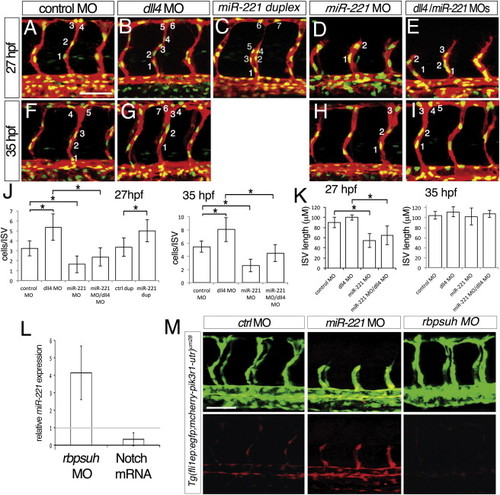
miR-221 Is Required for the Notch-Deficient “Hyper”-Angiogenesis Phenotype (A–I), Confocal micrographs of Tg(fli1a:negfp)y7;(kdrl:ras-cherry)s916 embryos, lateral views, dorsal is up, anterior to the left. Numbers indicate nuclei in representative intersegmental blood vessels (ISV). (A–E) Embryos at 27 hr post fertilization (hpf). (F–I) Embryos at 35 hpf. (A and F) Embryos injected with 25 ng of control MO. (B and G) Embryos injected with 15 ng of dll4 MO. (C) Embryo injected with 500 μM miR-221 duplex. (D and H) Embryo injected with 10 ng of miR-221 MO. (E and I) Embryos coinjected with 15 ng of dll4 MO and 10 ng of miR-221 MO. (J and K) (J) Quantification of endothelial number and (K) ISV length in Tg(fli1:ngfp)y7;(kdrl:ras-cherry)s916 embryos injected with indicated MO(s); -p < 0.0001. Measurements were determined for four adjacent ISVs per embryo in at least eight embryos from three separate injections. (L) Fold change of mature miR-221 levels assessed by qRT-PCR in embryos injected with 2.5 ng rbpsuh MO or with mRNA encoding an activated form of Notch compared to control embryos. (M) Confocal micrographs of Tg(fli1ep;mcherry-pik3r1-utr)um28 embryos injected with 10 ng control MO, 10 ng miR-221 MO, or 2.5 ng Rbpsuh MO. Lateral views, dorsal is up, anterior to the left. Scale bars are 50 μm. |
|
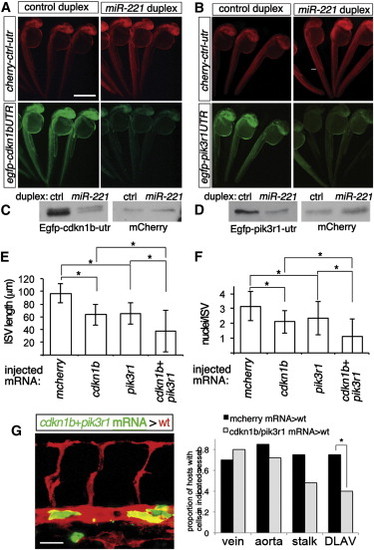
cdkn1b and pik3r1 Are Targets of miR-221 (A and B) Fluorescent images of embryos co-injected with 150 pg each of mcherry mRNA fused to control 32 UTR and egfp mRNA fused to (A) cdkn1b 32 UTR or (B) pik3r1 32 UTR with 100 μM indicated duplex RNA. Lateral views, dorsal is up, anterior to the left. Scale bar is 500 μm. (C and D) Western analysis of embryos in (A) and (B). (E and F) (E) ISV length and (F) cell number in Tg(fli1:egfp)y1 and Tg(fli1:negfp)y7 embryos, respectively, at 27 hpf injected with 500 pg of indicated mRNAs. For coinjections, 200 pg of cherry2A-cdkn1b and 300 pg cherry2A-pik3r1 mRNA were used. -p < 0.002. (G) Left, host Tg(kdrl:ras-mcherry)s916 embryo at 27 hpf following transplantation of cells from a Tg(fli1a:egfp)y1 embryo injected with 200 pg cdkn1b and 300 pg pik3r1 mRNA Right, proportion of embryos displaying donor cells in indicated vessel type. Control donor cells were from embryos injected with 500 pg mcherry mRNA. -p = 0.03. Scale bar is 25 μm |
|
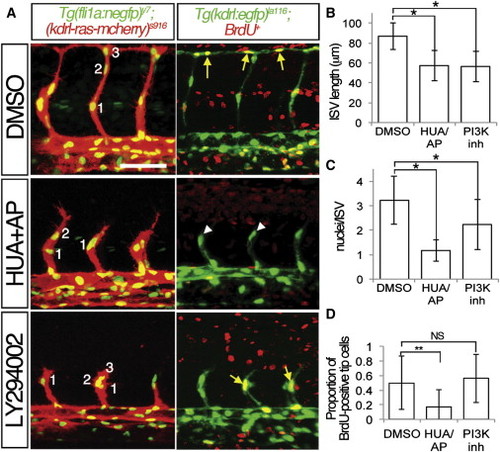
Proliferation and PI3K Are Required for ISV Growth (A) Embryos at 27 hpf treated with 4% DMSO, 150 μM 5-hydroxyurea, and 20 mM aphidocolin (HUA/AP), or 25 μM LY294002 (PI3K inh) beginning at 20 hpf. Left panels, confocal micrographs of Tg(fli1:negfp)y7;(kdrl:ras-cherry)s916 embryos. (right panels) Two-photon micrographs of Tg(kdrl:egfp)la116 embryos pulsed with BrdU at 20 hpf. Lateral views, dorsal is up, anterior to the left, yellow arrows denote BrdU-positive endothelial nuclei; BrdU-negative endothelial nuclei indicated by white arrowheads. Scale bar is 50 μm. (B and C) Quantification of (B) ISV length in microns and (C) number of nuclei per ISV in Tg(fli1:negfp)y7;(kdrl:ras-cherry)s916 embryos at 27 hpf treated as in (A). -p < 0.0001. (D) Quantification of BrdU-positive DLAV or ISV tip cells in Tg(kdrl:egfp)la116 embryos at 27 hpf treated as in (A). --p < 0.02. NS, not significant. PHENOTYPE:
|
|
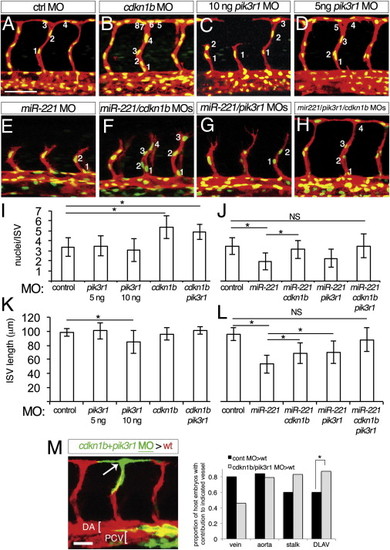
pik3r1 and cdkn1b Are Functional Downstream Targets of miR-221 (A–H) Tg(fli1a:negfp)y7;(kdrl:ras-cherry)s916 embryos at 27 hpf. Numbers denote cell nuclei of representative ISV. All embryos were co-injected with 1 ng of p53 MO. Scale bar is 50 μm. Embryo injected with (A) 15 ng control MO (B) 5 ng cdkn1b MO, (C) 10 ng pik3r1 MO, (D) 5 ng pik3r1 MO, (E) 10 ng miR-221 MO, (F) 10 ng miR-221 and 5 ng cdkn1b MOs, (G) 10 ng miR-221 and 5 ng pik3r1 MOs, and (H) 10 ng miR-221, 3 ng cdkn1b, and 3 ng pik3r1 MOs. (I–L) (I and J) Quantification of cells per ISV and (K, L) ISV length in embryos at 27 hpf injected with MOs as above, except control MO, which was injected at (I and K) 10 ng and (J and L) 15 ng doses. -p < 0.001; N.S., not significant. Measurements were obtained from four adjacent ISVs in at least ten embryos from three separate experiments. (M) Left, host Tg(kdrl:ras-mcherry)s916 embryo at 27 hpf following transplantation of cells from a Tg(fli1a:egfp)y1 embryo injected with 3 ng cdkn1b MO and 5 ng pik3r1 MO. Right, proportion of embryos displaying donor cells in indicated vessel type. Data from control donor cells is the same as in Figure 4D. -p = 0.07. Scale bar is 25 μm. PHENOTYPE:
|
|
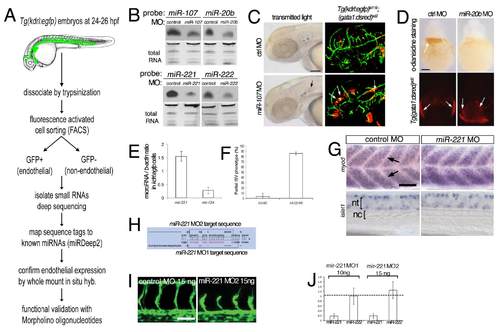
A screen for endothelial-expressed small RNAs in zebrafish identifies miR-221 as a proangiogenic microRNA. (A) Overview of screening strategy to identify endothelial-expressed microRNAs. (B) Northern analysis of microRNA expression in embryos injected with control Morpholino (MO) or MO targetting indicated microRNA. MO doses: 7 ng miR-107 MO, 14 ng miR-20b MO, 10 ng miR-221 MO, 20 ng miR-222 MO. microRNAs were detected using DIG-LNA probe. Total RNA served as loading control. (C) Left, transmitted light images of embryos injected with 7 ng control or miR-107 Morpholino showing evidence of cranial hemorrhage (indicated by black arrow). Right, leakage of gata1-positive cells from the vessels (denoted by white arrows) in Tg(kdrl:egfp)la116; (gata1:dsred)sd2 injected with miR-107 MO further indicating cranial hemorrhage. Scale bar is 100 μm (D) Top, o-dianisidine staining of hemoglobinized red blood cells in embryos injected with 14 ng control or miR-20b MO. Bottom, Tg(gata1:dsred)sd2 embryos injected with 14 ng control or miR-20b Morpholino. gata1: dsred-positive cells are present in both suggesting that miR-20b is required for terminal differentiation of erythroid cells. Scale bar is 100 μm. (E) qPCR analysis of miR-221 and miR-124 in GFP+ cells isolated from Tg(kdrl:egfp)la116 embryos by FACS at 24 hpf. microRNA expression levels in relation to bactin levels. (F) Percentage of embryos with partial ISV sprouts at 27 hpf after injection with 10 ng of control and miR- 221 MO. p-value < 0.0001, 90 embryos from 3 separate injection. (G) myod (top) and islet1 (bottom) expression in somites (arrowheads) and neural tube at 28 hpf. Left, embryos injected with 10 ng control MO. Right, embryos injected with 10 ng miR-221 MO. Differential interference contrast imaging, lateral views, dorsal is up, anterior to the left. Scale bar is 50 μm. nc – notochord, nt – neural tube. (H) Schematic of the miR-221 hairpin indicating position of MOs used for inhibiting maturation. (I) Confocal micrographs of Tg(kdrl:egfp)la116 embryos at 27 hpf injected with a control morpholino or a second morpholino (MO2) targeting miR-221. Scale bar is 50 μm. (J) qPCR analysis of mature miR-221 and miR-222 levels in embryos injected with either miR-221 MO. Levels are relative to embryos injected with 10 ng control MO. |
|
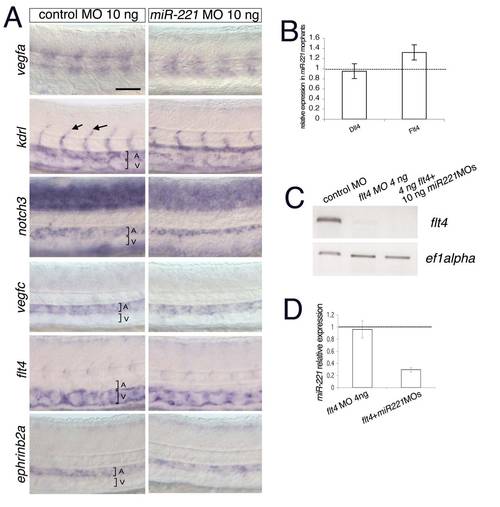
miR-221 is not required for arteriovenous differentiation. (A) Whole mount in situ hybridization of embryos injected with 10 ng of control (left) or miR-221 (right) morpholino. Embryos were fixed at 28 hpf and subjected to whole mount in situ hybridization using DIG-labeled antisense riboprobes against the indicated transcripts. Lateral views, dorsal is up, anterior to the left. Dorsal aorta and posterior cardinal vein are indicated by a bracket and A or V respectively. ISVs are indicated by arrows in the control panel for kdrl. Scale bar is 50 μm. (B) qRT-PCR quantification of dll4 and flt4 expression at 28 hpf in embryos injected with 10 ng miR-221. MO. Levels are relative to embryos injected with 10 ng control Morpholino. (C) RT-PCR for flt4 and ef1alpha in 28 hpf embryos injected with indicated Morpholinos. (D) Relative levels of miR-221 in embryos at 28 hpf injected with indicated Morpholinos compared to control embryos. |
|
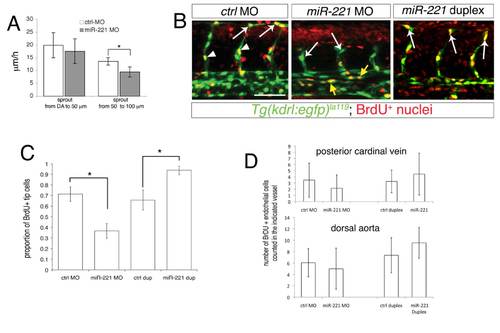
Quantification of migration and proliferation defects in miR-221 deficient and over-expressing embryos. (A) Quantification of endothelial migratory speed in ISV sprouts in embryos injected with 10 ng of control MO or 10 ng miR-221 MO. “DA to 50 μM” is the initial sprouting from the dorsal aorta to the horizontal myoseptum, while “50 to 100 μM” is the migration from horizontal myoseptum to the DLAV. Measurements were made in 3 ISV sprouts each following time-lapse analysis from 2 embryos injected with control or miR- 221 Morpholino. * p<0.05. (B) Confocal images of BrdU incorporation in Tg(kdrl:egfp)la116 embryos at 27 hpf; lateral views. Embryos injected with 10 ng control MO, 10 ng miR-221 MO, or 500 μM miR-221 duplex. White arrowheads indicate stalk cells, arrows indicate DLAV or tip cells. Yellow arrowheads indicate BrdU-positive endothelial cells in the dorsal aorta and posterior cardinal vein in miR-221 MO-injected embryos. Scale bar is 50 μm. (C) Quantification of BrdU-positive DLAV or endothelial tip cells within ISVs in Tg(kdrl:egfp)la116 embryos 27 hpf injected with 10 ng of control, 10 ng miR-221 morpholino, 500 μM control duplex, or 500 μM miR-221 duplex. * p-value < 0.05. (D) Quantification of BrdU-positive endothelial cells in posterior cardinal vein or dorsal aorta in Tg(kdrl:egfp)la116 embryos at 27 hpf injected as in (D). In both (C) and (D) BrdU incorporation was determined for 4 adjacent ISVs per embryo in at least 8 embryos from 3 separate injections for each manipulation. The differences between paired samples in (D) are not statistically significant. |
|
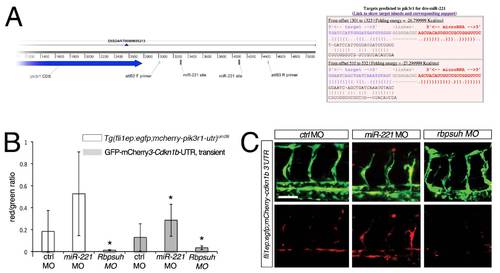
pik3r1 and cdkn1b are targets of miR-221 in zebrafish. (A) Left, pik3r1 transcript showing location of primers used to construct the pik3r1-3′UTR sensor fragment and location of predicted miR-221 binding sites. Right, output from rna22 showing pairing between mature zebrafish miR-221 and putative target sites in the pik3r1 3µ UTR. (B) Quantification of fluorescence in endothelial cell autonomous sensor assay. Red/green ratio indicates comparison of relative voxel intensities derived from 3-dimensional reconstructions of confocal micrographs of either stable Tg(fli1ep:egfp;mcherry-pik3r1-utr)um28 embryos or wild type embryos transiently co-injected with the cdkn1b endothelial sensor construct and Tol2 transposase mRNA. In both cases, embryos were injected with 10 ng control MO, 10 ng mir-221 MO, or 2.5 ng rbpsuh MO. * p<0.05; 7 to 13 embryos for each manipulation, obtained from 3 independent experiments. (C) Confocal micrographs of embryos transiently co-injected with the fli1ep:egfp;mcherry-cdkn1b-utr construct with indicated MOs (doses noted above). Lateral views, dorsal is up, anterior to the left. Scale bar is 50 μm. |
|
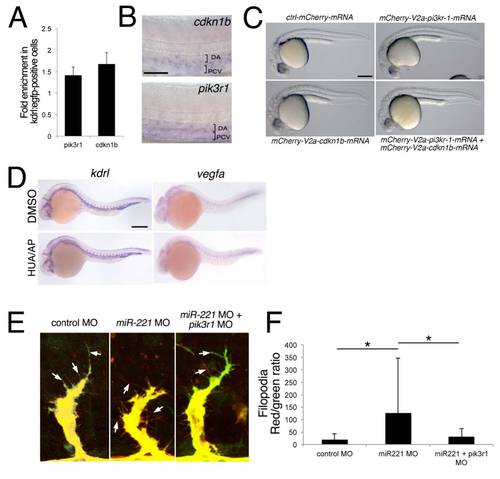
Proliferation and PI3 kinase signaling is required for ISV growth. (A) Quantitative RT-PCR showing relative levels of expression of pik3r1 and cdkn1b in GFP+ versus GFPcells isolated from Tg(kdrl:egfp)la116 embryos at 24 hpf. (B) Whole mount in situ hybridization detection of cdkn1b or pik3r1 in the dorsal aorta (DA) and posterior cardinal vein (PCV) at 24 hpf. (C) Transmitted light images of embryos at 27 hpf injected with 500 pg mRNA encoding MCherry (control), Mcherry-2A-Cdkn1b, Mcherry-2A-Pikr1 or co-injected with 200 pg of mcherry-2A-cdkn1b and 300 pg of mcherry-2A-pik3r1 mRNA. Lateral views, dorsal is up, anterior to the left. Scale bar is 250 μm. (D) Whole mount in situ hybridization of vegfa and kdrl in embryos treated with 4% DMSO, 150 μM 5- hydroxyurea (HUA) and 20 mM aphidocolin (AP), or 25 μM LY294002 beginning at 20 hpf. Scale bar is 250 μm. (E) 2-photon microscopy of single ISVs in Tg(fli1ep:phaktegfp-2A-memcherry)um63;(kdrl:tagrfpcaax)is19 embryos injected with 15 ng control MO (left), 10 ng miR-221 MO (middle) or 5 ng pik3r1 MO and 10 ng miR- 221 MO (right). Filopodia are denoted by arrows. Embryos at 24 hpf (control MO) or 28 hpf (miR-221 and miR-221/pik3r1 MO). Scale bar is 10 μm. (F) Quantification of red and green fluorescence in ISV filopodia following injection with indicated Morpholinos as in (E). Values indicate relative ratio of red (control) over PH-Akt1-EGFP fluorescence. Fluorescence was measured in at least 20 filopodia from 3 ISVs each in 3 embryos for each manipulation. An increased ratio is indicative of decreased PH-Akt1-EGFP localization in filopodia. * p< 0.05. |
|
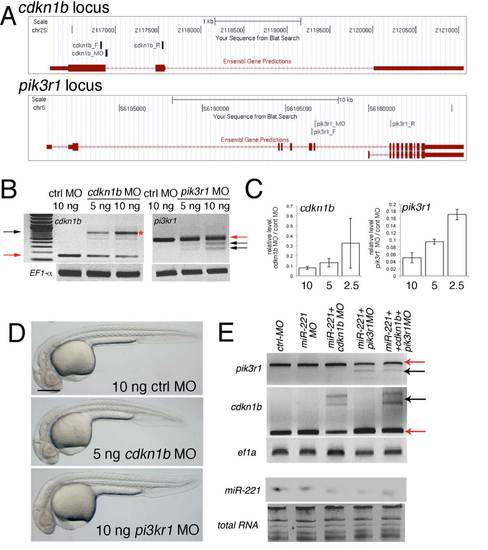
Morpholino-mediated knockdown of cdkn1b and pik3r1. (A) cdkn1b and pik3r1 loci indicating position of splice-blocking MOs and PCR primers used in (B, E). Images were taken from the UCSC genome browser (Zv8). (B) PCR amplification of cdkn1b or pik3r1 across exon junctions targeted by MOs indicated in (A). MO dose and target is indicated. ef1alpha is included as a control. Red arrows denote expected wild type fragment. Black arrows indicate mis-spliced products. (C) qRT-PCR of cdkn1b and pik3r1 in MO-injected embryos. Levels are presented as a ratio of the level in cdkn1b or pik3r1 Morpholino-injected embryos (dose in ng on x-axis) over control MO injections. (D) Transmitted light images of embryos at 27 hpf injected with 10 ng control MO, 5 ng of cdkn1b MO, or 10 ng of pik3r1 MO. Scale bar is 250 μm. (E)Top, PCR of cdkn1b and pik3r1 in embryos injected with indicated MOs. Red arrow – wild type fragment. Black arrow – mis-spliced product. We observed comparable knockdown of cdkn1b and pik3r1 levels in single, double, and triple MO injections. Doses for single and double MO injection: 5 ng each of cdkn1b MO or pik3r1 MO and 10 ng of miR-221; triple injections: 10 ng of miR-221MO co-injected with 3 ng each of cdkn1b and pik3r1 MOs. All MOs were co-injected with 1ng tp53 MO. Bottom panels, Northern analysis of miR-221 levels following MO injections. Total RNA is loading control. |
Reprinted from Developmental Cell, 22(2), Nicoli, S., Knyphausen, C.P., Zhu, L.J., Lakshmanan, A., and Lawson, N.D., miR-221 Is Required for Endothelial Tip Cell Behaviors during Vascular Development, 418-429, Copyright (2012) with permission from Elsevier. Full text @ Dev. Cell


