- Title
-
Differential regulation of Period 2 and Period 3 expression during development of the zebrafish circadian clock
- Authors
- Delaunay, F., Thisse, C., Thisse, B., and Laudet, V.
- Source
- Full text @ Gene Expr. Patterns
|
Structure and phylogenetic analysis of zebrafish PER2. (A) Alignment of zebrafish PER2 and PER3 amino acid sequences. Black boxes indicate identical residues and the underline denotes the PAS region. (B) Evolutionary conservation of phosphorylation sites in vertebrate PER2 proteins. The human Per2 sequence was corrected by introducing a nucleotide at position 3652 ( Toh et al., 2001). Open boxes denote putative phosphorylated Ser residues and the black box indicates the Ser662 residue, which is mutated in human FAPS syndrome. PER2 sequences used for the alignment were from zebrafish (AY171100), Xenopus (AF199499), quail (AB029890), human (AB002345). (C) Phylogenetic tree of the period protein family. Sequences used for the alignment were Drosophila PER (M30114), mouse PER1 (AB002108), mouse PER2 (AF035830), mouse PER3 (AF050182) zebrafish PER2 (AY171100) and zebrafish PER3 (AF254792) protein. Amino acid sequences were aligned using ClustalW. A phylogentetic tree of the Period gene family was derived using the neighbor-joining method with 1000 replicate searches. (D) RNase protection analysis of Per2 and EF1α mRNA expression in muscle of adult zebrafish. Yeast (Y) RNA was included as a negative control. Black and white bars indicate the dark and light phases, respectively (ZT, zeitgeber time). |
|
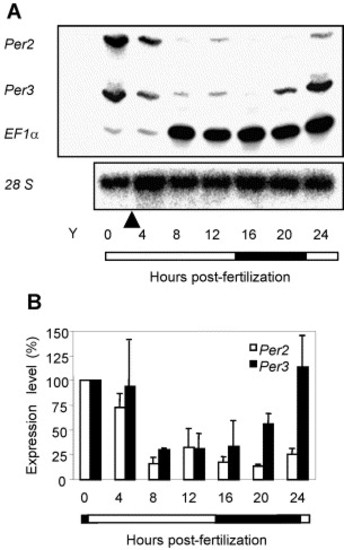
Differential regulation of Per2 and Per3 expression during zebrafish early embryogenesis. (A) Embryos kept in a LD14:10 light/dark cycle were collected every 4 h from the time of fertilization until 24 hpf. Per2, Per3 and EF1α mRNA expression was analyzed by RNase protection assay. As expected, a strong induction of the elongation factor gene EF1α expression was observed after the midblastula transition which in zebrafish occurs at 3-4 hpf at 28°C (Gao et al., 1997). Yeast (Y) RNA was included as a negative control. 28S rRNA levels were determined by Northern blot analysis and used as control for loading. The arrow indicates the midblastula transition. Black and white bars indicate the dark and light phases, respectively (ZT, zeitgeber time). (B) Quantification of the RNase protection assay shown in (A). Each time point included a pool of 100-200 embryos and data were expressed relative to the time 0 level and represent mean±SD from three independent experiments. |
|
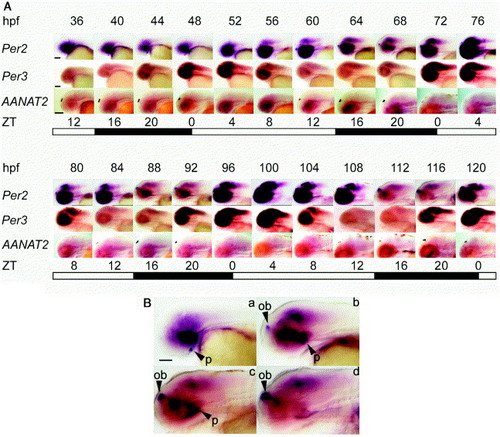
Differential regulation and expression pattern of Per2 and Per3 during zebrafish development. Embryos kept in a LD14:10 light/dark cycle were collected every 4 h from 36 to 120 hpf. (A) Expression of Per2, Per3 and AANAT2 was analyzed by whole mount in situ hybridization. Black and whites bars indicate the dark and light phases, respectively (ZT, zeitgeber time). (B) High magnification showing constitutive Per2 expression restricted to the embryonic olfactory bulb (ob) and pituitary (p) at 44 (A), 68 (B), 92 (C) and 116 hpf (D). Scale bar, 100μm. |
Reprinted from Gene expression patterns : GEP, 3(3), Delaunay, F., Thisse, C., Thisse, B., and Laudet, V., Differential regulation of Period 2 and Period 3 expression during development of the zebrafish circadian clock, 319-324, Copyright (2003) with permission from Elsevier. Full text @ Gene Expr. Patterns


