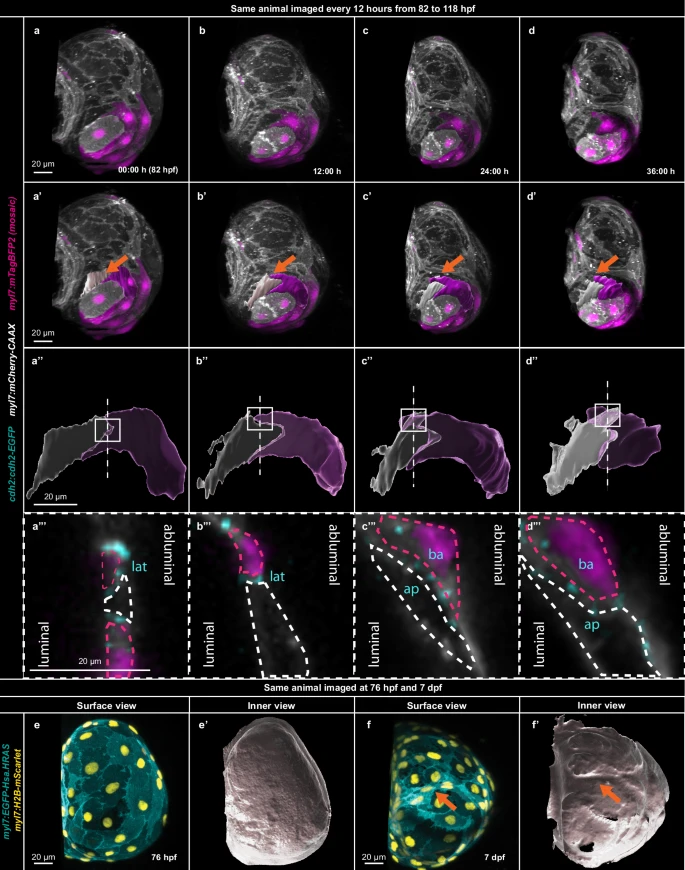
Fig. 2 Atrial cardiomyocyte elongation leads to cell intercalation and convergent thickening.a–d 3D airyscan imaging of the same larva every 12 h from 82 to 118 hpf; CM membranes shown in white (myl7:mCherry-CAAX) and mosaic CM cytoplasmic expression in magenta (myl7:mTagBFP2). a’–d” 3D segmentation of two elongating and intercalating CMs reconstructed with opaque (a’–d’) and transparent (a”–d”) surfaces, revealing cell intercalation; orange arrow points to the segmented CMs; squares and dashed lines indicate cross-section region. a”’–d”’, Cross-sections through elongating atrial CMs; dashed lines outline the two intercalating CMs; N-cadherin shown in cyan (cdh2:cdh2-EGFP); lat–lateral adhesion; ap–apical adhesion, ba – basal adhesion; (a–d”’) all 3D surfaces of the mTagBFP2+ CM shown in magenta and all 3D surfaces of the mTagBFP2- CM in white. e, f Outer surface views of 3D airyscan images of the same atrium at 76 hpf and 7 dpf; CM membranes shown in cyan (myl7:EGFP-Hsa.HRAS) and CM nuclei in yellow (myl7:H2B-mScarlet). e’, f’ Inner surface views of the same 3D airyscan images at 76 hpf and 7 dpf; orange arrows point to CMs in the inner ridges.
Image
Figure Caption
Acknowledgments
This image is the copyrighted work of the attributed author or publisher, and
ZFIN has permission only to display this image to its users.
Additional permissions should be obtained from the applicable author or publisher of the image.
Full text @ Nat. Commun.

