
|
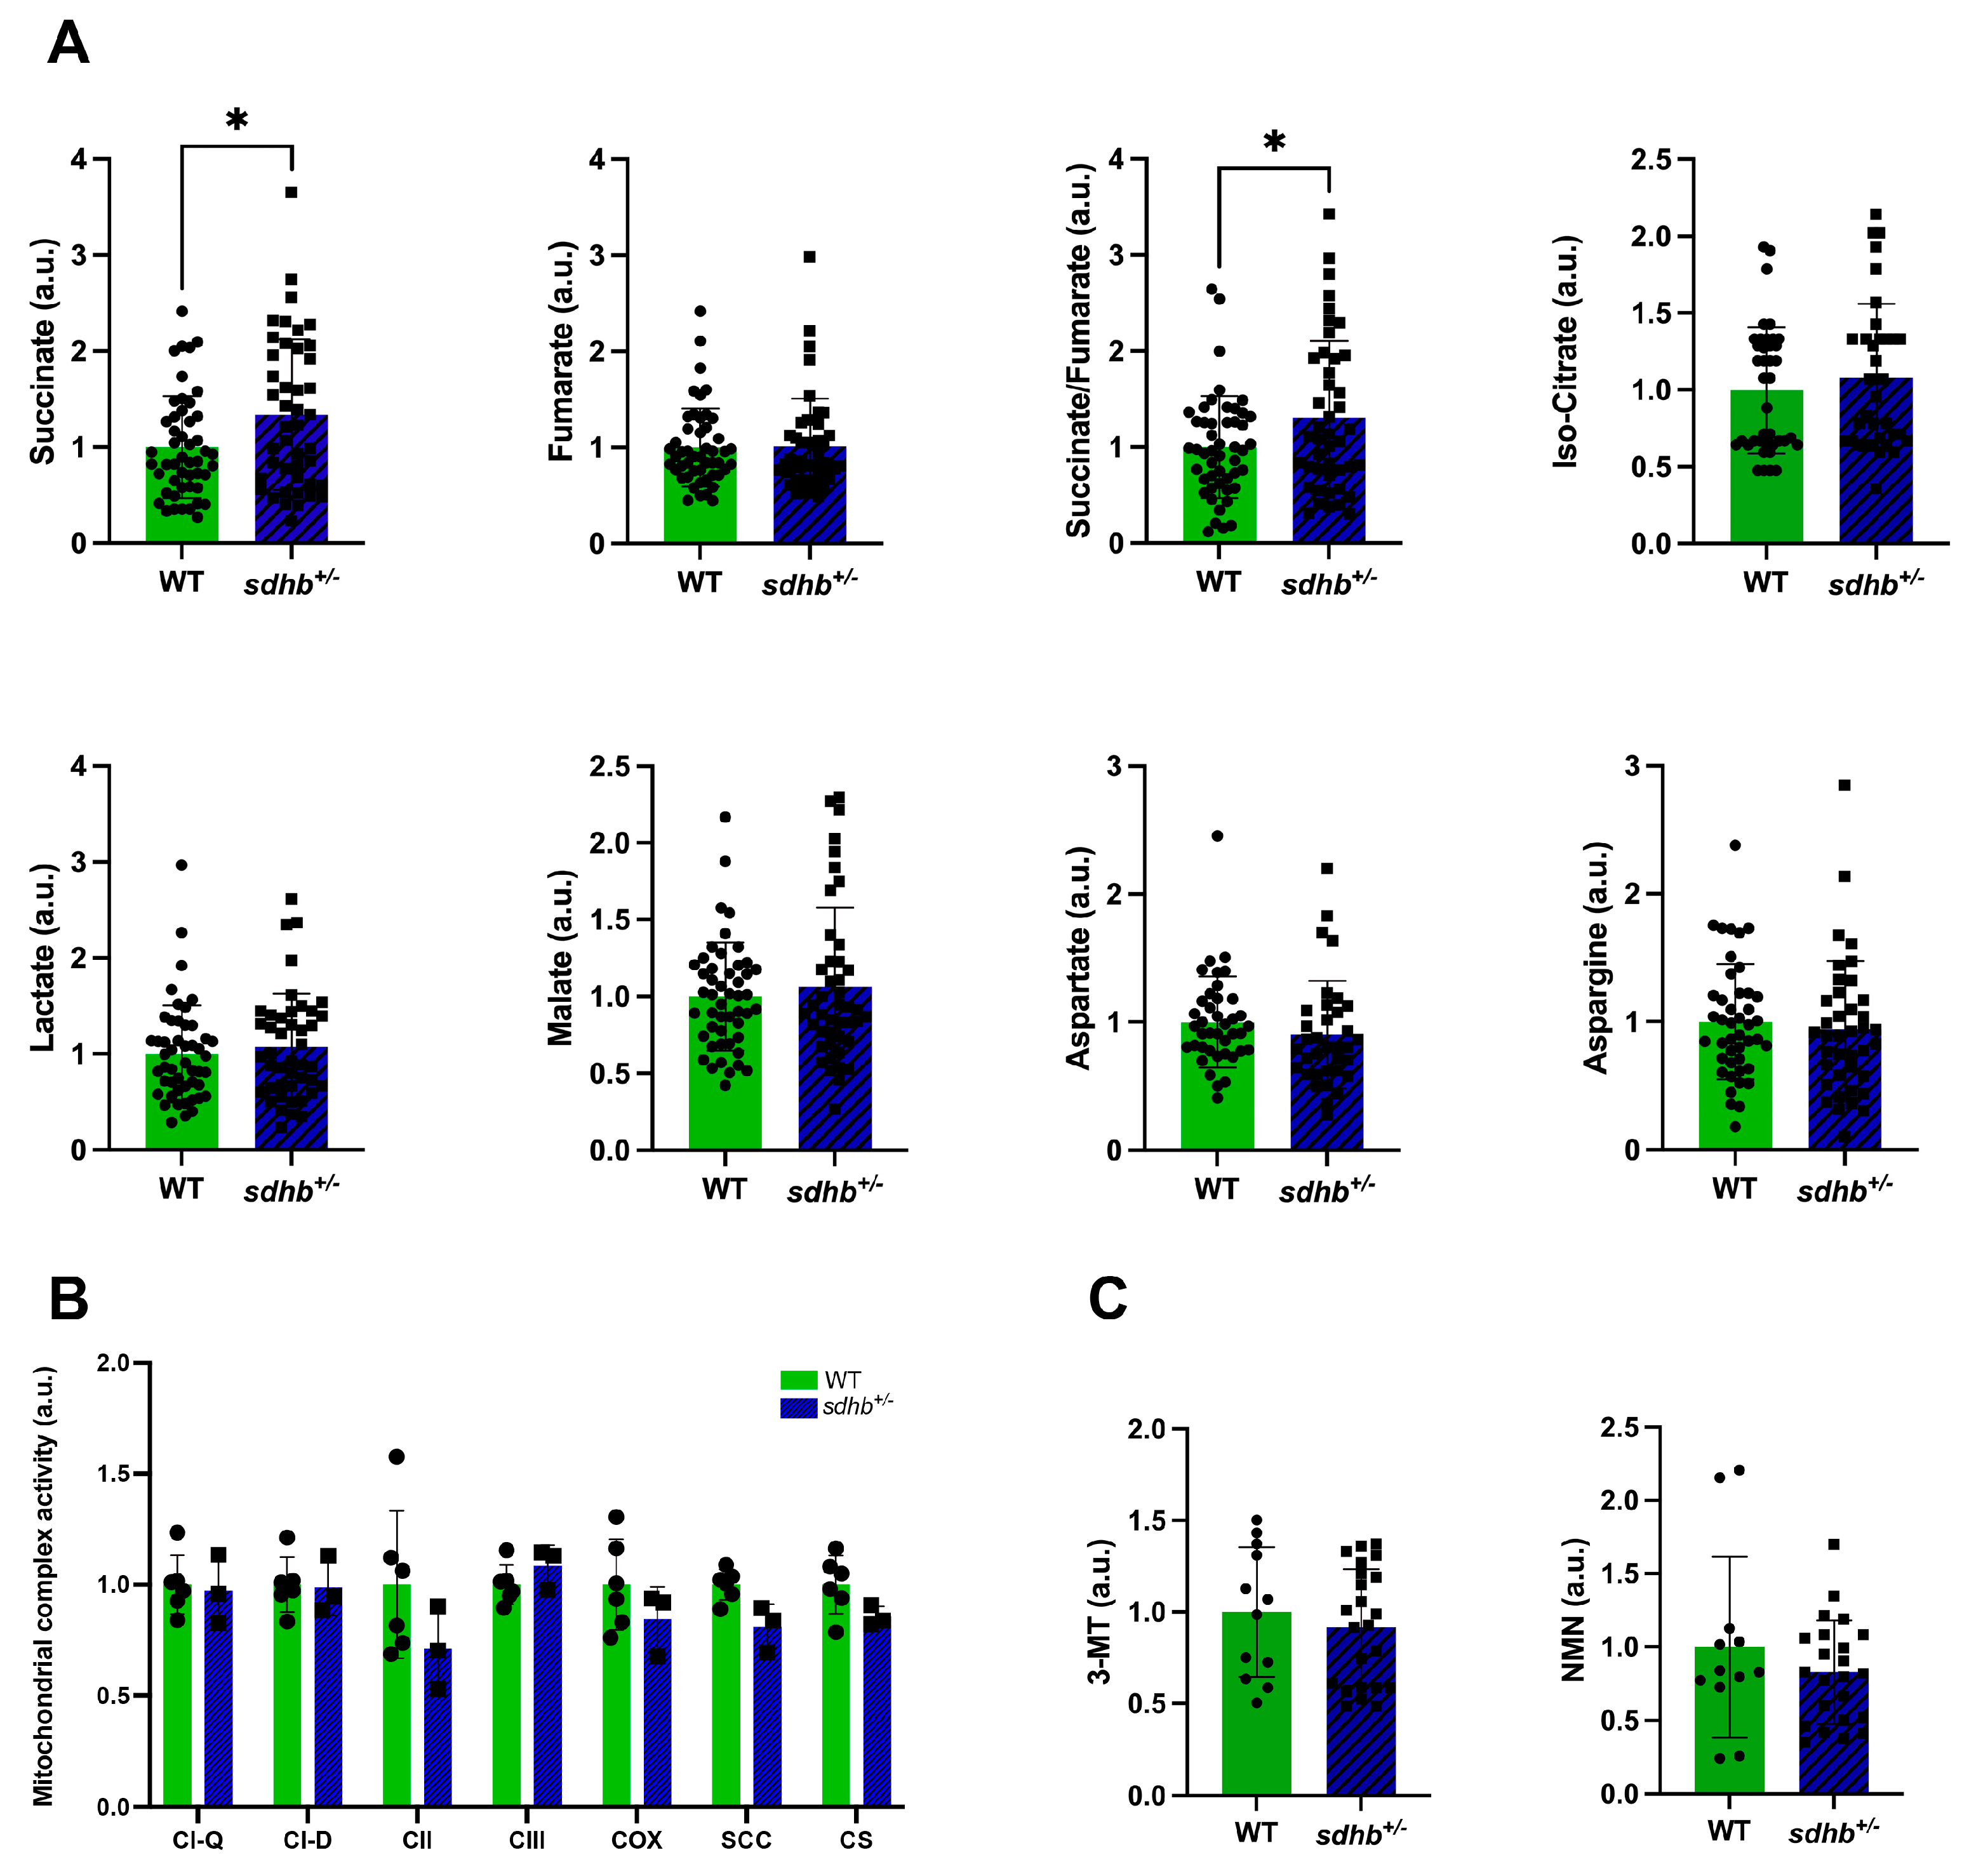
Fig. 4 Metabolomics, mitochondrial complex activity, and metanephrine levels of adult heterozygous sdhb mutant and WT zebrafish. All values are standardised relative to the associated WT mean and expressed in arbitrary units (a.u.). (A) Abundance of metabolites in muscle tissue of heterozygous sdhb mutant (n = 44) and WT (n = 49) zebrafish (n is the total of three replicates). Succinate levels and succinate/fumarate ratios were significantly increased in heterozygous sdhb mutants compared with their WT siblings. (B) Mitochondrial complex activity in heterozygous sdhb mutant (n = 3) and WT (n = 6) zebrafish. Activity levels for all mitochondrial complexes were not significantly different. CI-D: complex I; CI-Q: quinone; CII: complex II; CIII: complex III; COX: complex V/cytochrome c oxidase; SCC: cytochrome P-450; CS: citrate synthase. (C) Catecholamine metabolite levels in the swimming water of heterozygous sdhb mutant (n = 23) and WT (n = 12) zebrafish. 3-MT: 3-Methoxytyramine; NMN: Normetanephrine. Student’s t test for metabolomics analysis and catecholamine metabolite analysis, Mann–Whitney U test for mitochondrial complex activity analysis. * p < 0.05.