
|
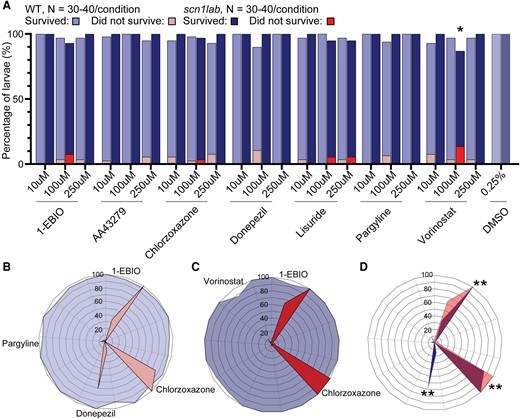
Fig. 2 Toxicology assay for larvae following behavioral assessment. (A) Percent survival of WT and scn1lab larvae (N = 30 or 40 per condition with minimum independent 3 replicates). Percentage of larvae that did not survive are overlayed. Vorinostat at 100 µM significantly reduced scn1lab survival compared to DMSO-treated controls. (B) Radar plot quantifying touch responses of WT larvae (N = 30 or 40 per condition with minimum independent three replicates). Dotted lines segment each candidate ASM and toxicity is plotted as a percentage of larvae. Toxic ASMs are labelled. (C) Radar plot showing candidate ASM toxicity for scn1lab larvae (N = 30 or 40 per condition with minimum independent three replicates). (D) Radar plot of WT and scn1lab toxicity overlayed. 1-EBIO and Chlorzoxazone were toxic for both populations. Donepezil uniquely impacted WT larvae. One-way ANOVA was performed for statistical analysis, P < 0.01 = *, P < 0.0001 = **.