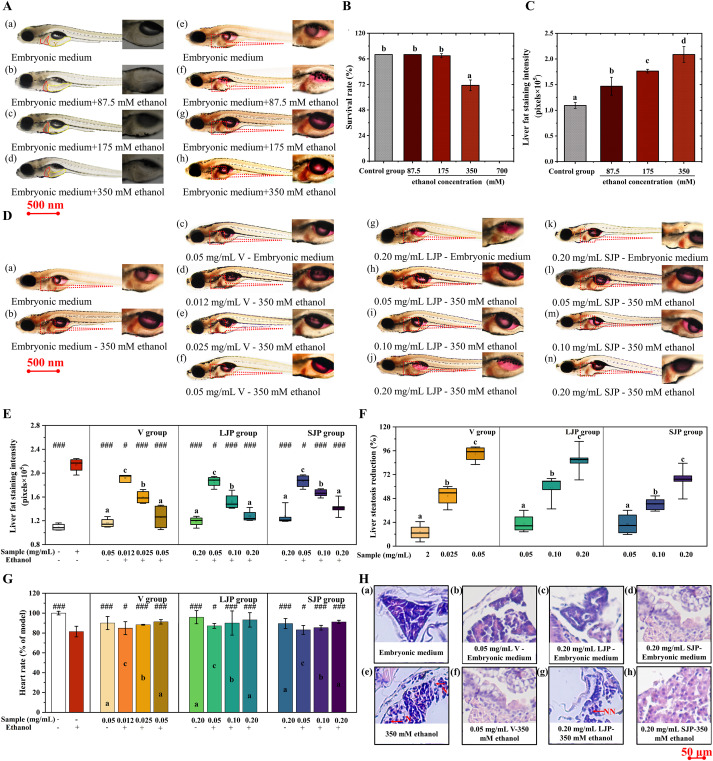
Fig. 2 Micrograph snapshots (a–d) and comprehensive whole-mount Oil red O staining images (e–h) of zebrafish larvae liver across varied ethanol gradients (A). Denotations: L-hepatic zone; Y-yolk sac area. A circumscribed liver, enhanced for visual clarity, delineates lipid droplet accumulation utilized in steatosis scoring. Survival rates of zebrafish larvae across ethanol concentration gradients (B). Grayscale intensity quantifications of larval liver exposed to varying ethanol gradients (C). Representative imagery of whole-mount Oil red O staining in zebrafish larvae (D), alongside hepatic fat staining intensities (E), reduction in hepatic steatosis (F), cardiac rate metrics (G). Analyses were conducted using ImageJ software. Prototypical histopathological snapshots of zebrafish larval livers (H) with annotations: NN-normative nucleus; NP-nuclear peripheral alignment; V-vacuolation; K-karyolysis. Data represented as mean ± SD. Significance markers: #<0.05, ##<0.01, ###<0.001 when compared against the model group, evaluated via student's t-test. Different lowercase letters denote significant differences. (For interpretation of the references to colour in this figure legend, the reader is referred to the Web version of this article.)
Image
Figure Caption
Acknowledgments
This image is the copyrighted work of the attributed author or publisher, and
ZFIN has permission only to display this image to its users.
Additional permissions should be obtained from the applicable author or publisher of the image.
Full text @ Heliyon

