IMAGE

Figure 5.

ID
ZDB-IMAGE-240416-47
Source
Figures for Li et al., 2024
Image
Figure Caption

Figure 5.

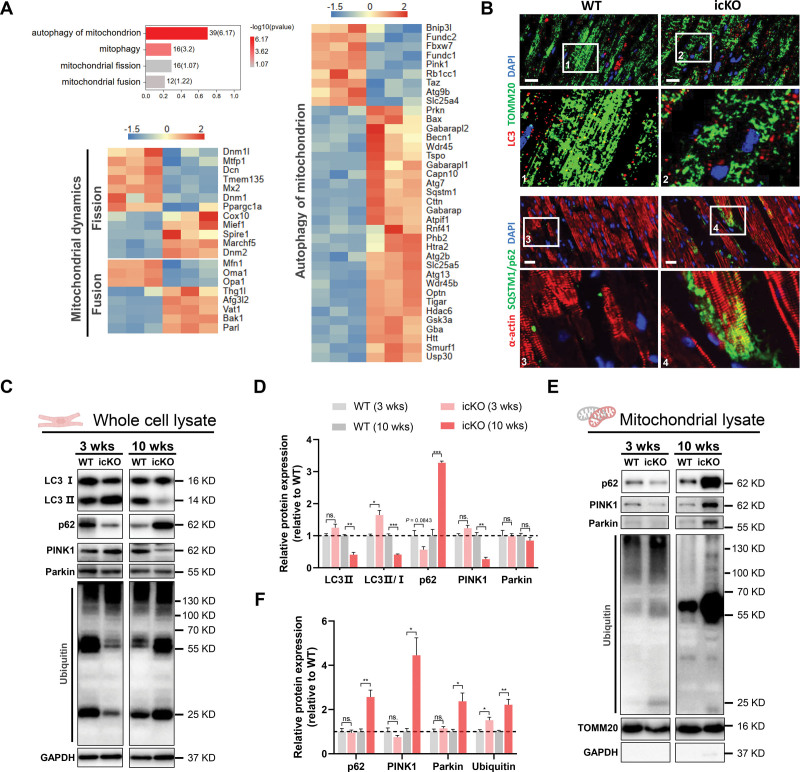
FARS2 deficiency causes MQC system disruption. A, Gene Ontology analysis of mitochondrial quality control (MQC) system–related biology process changes and heatmap of key genes in the autophagy of mitochondrion and mitochondrial dynamics pathways from RNA sequencing analysis. B, Top, Representative immunofluorescence images of LC3 (red) and TOMM20 (green) from mouse heart 10 weeks after inducible cardiac-specific Fars2 knockout (icKO) or in wild-type (WT) mice. Bottom, Representative immunofluorescence images of α-actin (red) and SQSTM1/p62 (green) from mouse heart 10 weeks after icKO or in WT mice. Scale bar=20 μm. C, Western blots of proteins in autophagy of mitochondria in whole-cell lysate of WT and icKO mice. D, Quantification of relative protein expression in C (n=3). E, Western blots of proteins in autophagy of mitochondria in mitochondrial lysate of WT and icKO mice. F, Quantification of relative protein expression in E (n=3). *P<0.05; **P<0.01; ***P<0.001.

Acknowledgments
This image is the copyrighted work of the attributed author or publisher, and ZFIN has permission only to display this image to its users. Additional permissions should be obtained from the applicable author or publisher of the image. Full text @ Circulation