
Image
|
Figure Caption
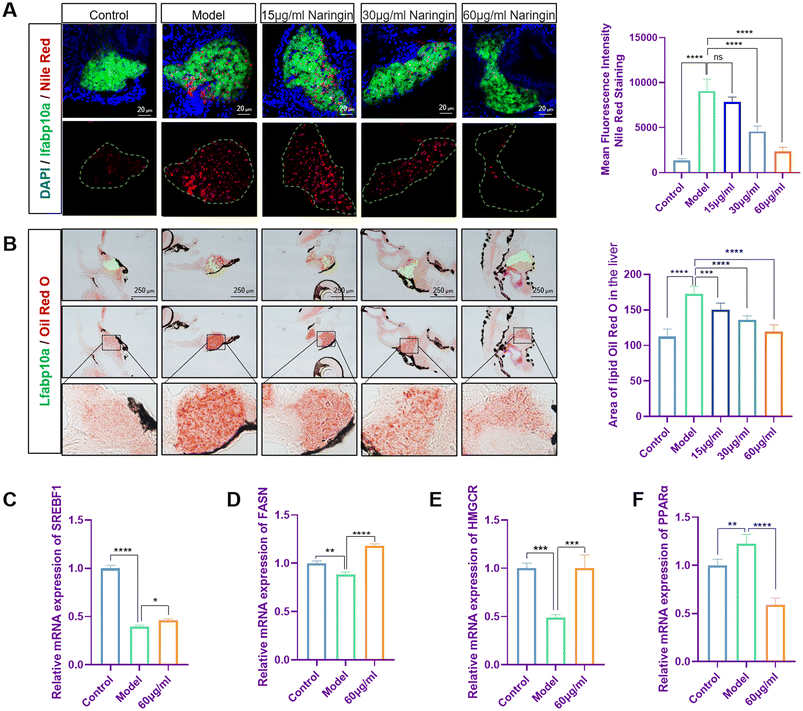
Fig. 4 Naringin alleviated lipid metabolism disorders in TAA-induced zebrafish liver fibrosis. (A) Nile red staining of frozen sections of zebrafish larvae (n = 7). (B) Oil red O staining of zebrafish larvae. Figures are magnified at ×100 (n = 7). (C–F) The qPCR analysis of SREBF1, FASN, HMGCR and PPARα mRNA expression in zebrafish larvae (n = 3). The mRNA expression was normalized to β-actin mRNA expression and presented as a fold change compared with the control group. ns denotes no significance, *p < 0.05, **p < 0.01, ***p < 0.001, and ****p < 0.0001.
Acknowledgments
This image is the copyrighted work of the attributed author or publisher, and
ZFIN has permission only to display this image to its users.
Additional permissions should be obtained from the applicable author or publisher of the image.
Full text @ Food Funct