
Image
|
Figure Caption
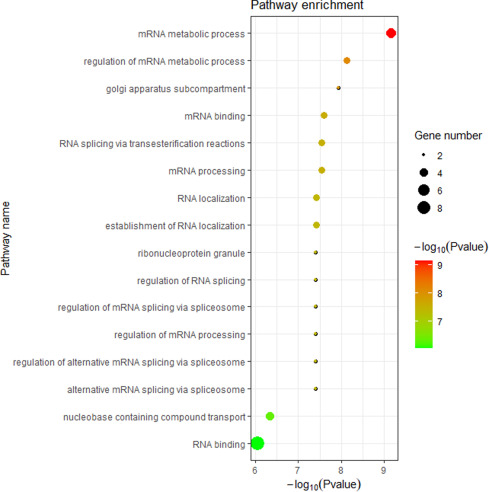
Fig. 2 Bubble diagram of the pathway analysis of potentially associated variants for Rey Complex Figure Test Delayed Component. The p value increased from top to bottom. All the pathways displayed in the figure were significant (corrected p < .05). The color represents p value, while the size represents the number of associated genes enriched in the particular pathway. mRNA, messenger RNA.
Acknowledgments
This image is the copyrighted work of the attributed author or publisher, and
ZFIN has permission only to display this image to its users.
Additional permissions should be obtained from the applicable author or publisher of the image.
Full text @ Biol Psychiatry Glob Open Sci