IMAGE

Fig. 3

ID
ZDB-IMAGE-231221-26
Source
Figures for Campbell et al., 2023
Image
Figure Caption

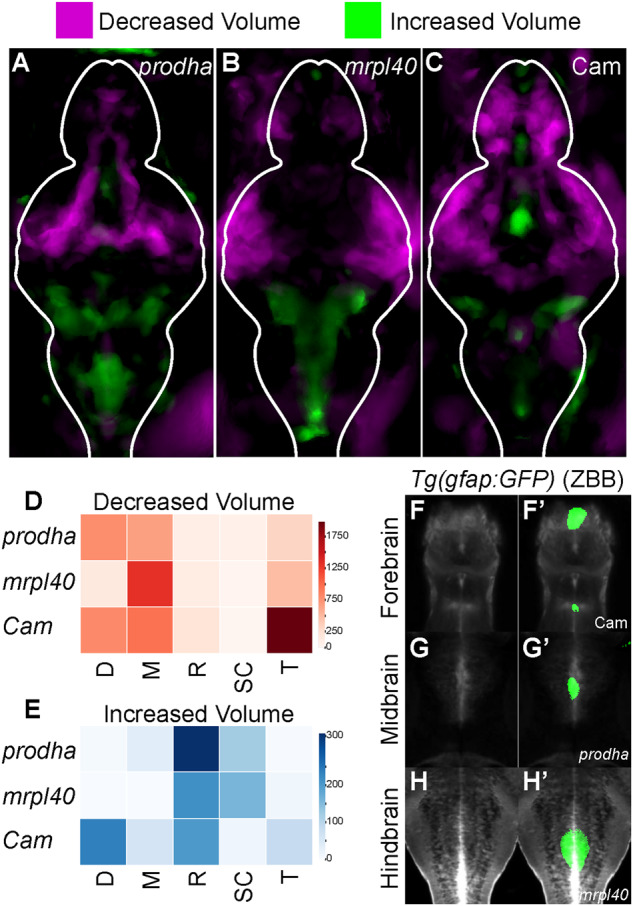
Fig. 3 Mitochondrial disruption leads to alterations in brain volume.

AC Differences in brain volume in mitochondrial mutants and pharmacologically inhibited larvae. Deformation-based morphometry for prodha mutants (A), mrpl40 mutants (B), and Chloramphenicol-treated (C) larvae shows differences in multiple brain areas. Images are sum projections of whole-brain z-stacks. Magenta designates areas that are reduced in volume compared to siblings/controls and Green designates areas that are increased in volume compared to siblings/controls. White outline indicates outline of brain. Analysis performed as in Thyme et al. [35]. Representative images of two biological replicates with at least n = 11 wildtypes/controls and n = 12 mutants/treated. DE Heatmaps illustrating degree to which volume signals in AC occupy various brain regions in arbitrary units. Higher values indicate larger reductions (D)/increases (E) in volume in designated region. Values are scaled based on size of the region as performed in Randlett et al. [36]. D diencephalon, M mesencephalon, R rhombencephalon, SC spinal cord, T telencephalon. FH’ Colocalization of increases in brain volume with gfap reporter line. Average signal of a Tg(gfap:GFP) line that has been registered to the Zebrafish Brain Browser (ZBB) atlas was merged with increased volume signals for prodha mutants (G-G’), mrpl40 mutants (H-H’), and Chloramphenicol-treated (F-F’) larvae. Increased volume colocalizes with GFP signal in multiple brain regions in the ventricle-occupying midline.

Acknowledgments
This image is the copyrighted work of the attributed author or publisher, and ZFIN has permission only to display this image to its users. Additional permissions should be obtained from the applicable author or publisher of the image. Full text @ Mol. Psychiatry