IMAGE

Fig. 6.

ID
ZDB-IMAGE-231220-44
Source
Figures for Nagorska et al., 2023
Image
Figure Caption

Fig. 6.

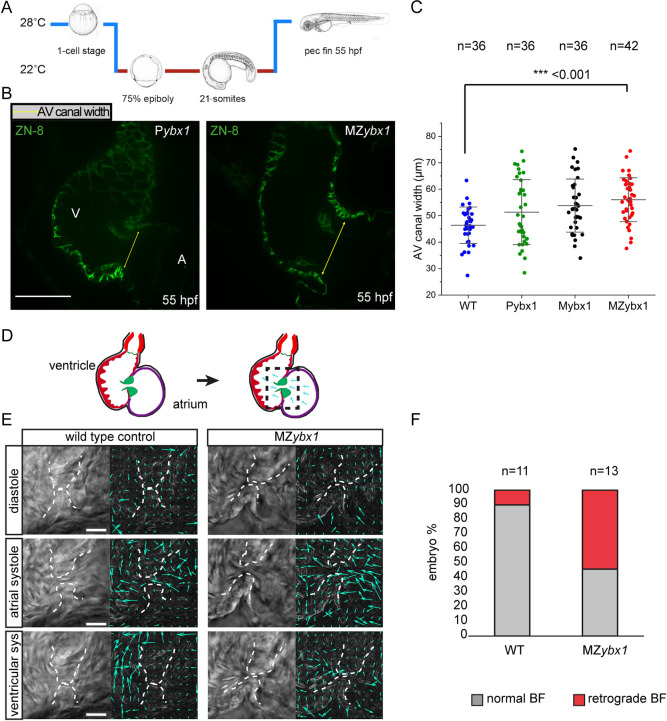
Ybx1 mutant embryos show abnormal heart morphogenesis. (A) Schematic of temperature shift experiments. ybx1 mutant embryos and controls were shifted to 22°C at 75% epiboly until 21-som and then grown at 28°C until 55 hpf. (B) Confocal images of zebrafish heart showing immunofluorescence with the ZN-8 antibody to label the of atrioventricular (AV) canal. Yellow arrows indicate the width of the AV canal in control Pybx1 and MZybx1 mutant embryos. A, atrium; V, ventricle. Scale bar: 25 µm. (C) Quantification AV canal width in µm from immunostaining of wild-type (WT; blue, n=36), Pybx1 (green, n=36), Mybx1 (black, n=36) and MZybx1 embryos (red, n=42). ANOVA test was used for statistical analysis (P=0.00016361; ***P<0.001). (D) Schematic of zebrafish heart at 5 dpf (left) and schematic of PIV analysis (right); black dashed box shows the area of the heart imaged and analysed. (E) Left: DIC images from movies of wild-type and ybx1 mutant hearts during diastole, atrial systole and ventricular systole. Right: PIV analysis of the images; cyan arrows indicate movements of red blood cells. Scale bars: 20 µm. (F) Percentage of embryos showing normal blood flow (BF) versus retrograde BF in wild-type (n=11) and ybx1 mutant (n=12) embryo groups.

Acknowledgments
This image is the copyrighted work of the attributed author or publisher, and ZFIN has permission only to display this image to its users. Additional permissions should be obtained from the applicable author or publisher of the image. Full text @ Development