IMAGE

Fig 11

ID
ZDB-IMAGE-231215-231
Source
Figures for Maung Ye et al., 2023
Image
Figure Caption

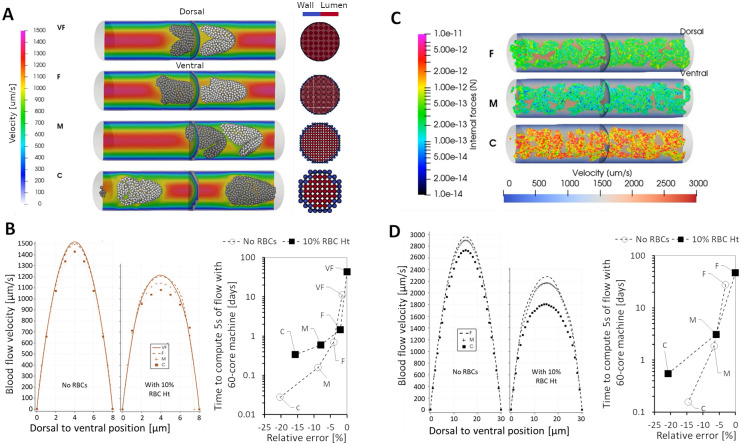
Fig 11 Grid independence testing for numerical accuracy and precision in the simulations.

(A) Snapshots of the ISV-domain grid testing simulations with an 8 μm diameter by 40 μm length vessel segment under steady-state 18 Pa flow-driving pressure. The simulations were performed with computational grids at very fine (VF), fine (F), medium (M) and coarse (C) grid resolutions. For clarification of the grid resolution dimensions refer to main text. Plot fills are colored for flow velocity on the left image while circle cross sections on the right image indicate the grid voxels which are colored in red for lumen and blue for vessel wall. (B) The predicted flow velocities under varying grid resolutions (left) and the computing-cost versus simulation error matrix (right). (C) Snapshots of the CA-domain grid testing simulations with a 30 μm diameter by 150 μm length vessel segment under steady-state 18 Pa flow-driving pressure. The simulations were performed with computational grids at fine (F), medium (M) and coarse (C) grid resolutions. Plot fills are colored for flow velocity on the left image. (D) The predicted flow velocities under varying grid resolutions (left) and the computing-cost versus simulation error matrix (right).

Acknowledgments
This image is the copyrighted work of the attributed author or publisher, and ZFIN has permission only to display this image to its users. Additional permissions should be obtained from the applicable author or publisher of the image. Full text @ PLoS Comput. Biol.