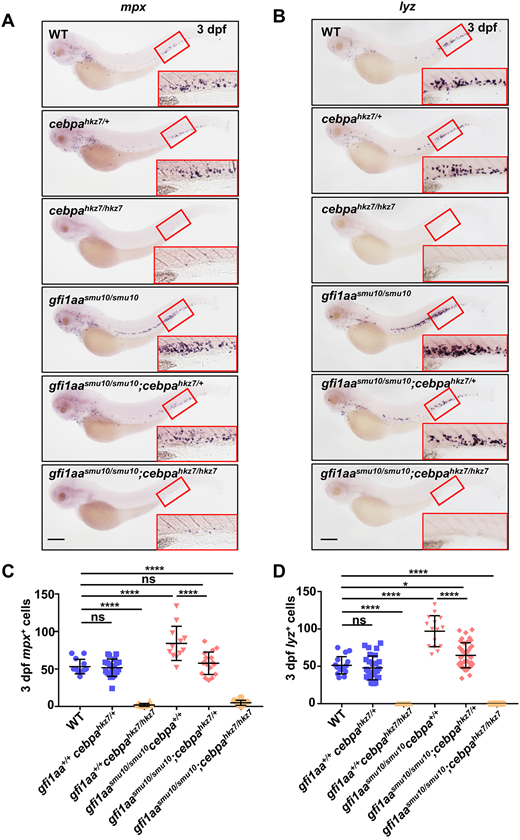
Fig. 4 Downregulation of cebpa rescues the neutrophil lineage expansion of the gfi1aasmu10 mutant. (A,B) Expression of mpx (A) and lyz (B) in embryos of gfi1aasmu10/+ and cebpahkz7/+ outcrossed progeny. WISH of 3 dpf embryos of WT, gfi1aa+/+cebpahkz7/+, gfi1aa+/+cebpahkz7/hkz7, gfi1aasmu10/smu10cebpa+/+, gfi1aasmu10/smu10cebpahkz7/+ and gfi1aasmu10/smu10cebpahkz7/hkz7. Insets show enlargements of the red boxed regions of the CHT. Scale bars: 200 μm. (C,D) Quantification of mpx+ cells (C) and lyz+ cells (D) in each genotype group of mutants. Data are mean±s.d. nmpx=187, nlyz=241.*P<0.05, ****P<0.0001 (one-way ANOVA). ns, not significant (P>0.05). See also Tables S6 and S7.
Image
Figure Caption
Figure Data
Acknowledgments
This image is the copyrighted work of the attributed author or publisher, and
ZFIN has permission only to display this image to its users.
Additional permissions should be obtained from the applicable author or publisher of the image.
Full text @ Development

