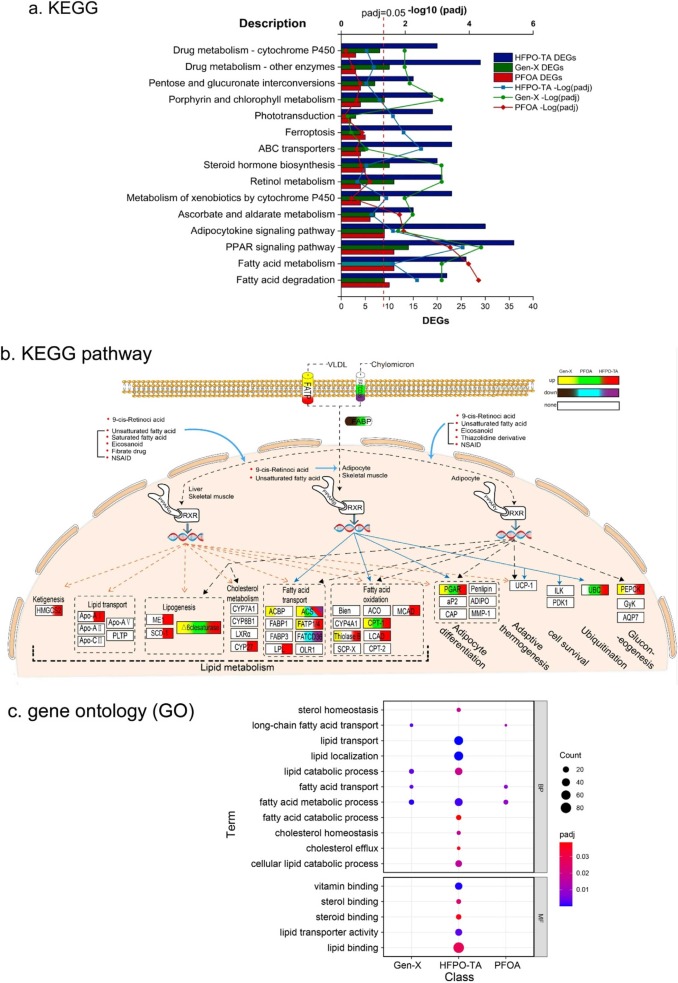
Fig. 4 Analysis of differential gene KEGG, gene ontology (GO) enrichment after 72 hpe exposure of zebrafish to PFOA and alternatives. KEGG double Y-axis plot in (a), the bar graph shows the number of enriched differential genes and the line graph shows the Padj values. Among them, the most significant enrichment was in lipid metabolism, degradation and PPAR pathway; the changes of specific factors in PPAR pathway were plotted (b); Bubble charts (c) of Gen-X, PFOA, HFPO-TA differential gene GO analysis compared to controls. GO showed that the more significant functional enrichment was also involved in lipid metabolism related. BP: Biological Process; MF: Molecular Function.
Image
Figure Caption
Figure Data
Acknowledgments
This image is the copyrighted work of the attributed author or publisher, and
ZFIN has permission only to display this image to its users.
Additional permissions should be obtained from the applicable author or publisher of the image.
Full text @ Ecotoxicol. Environ. Saf.

