
|
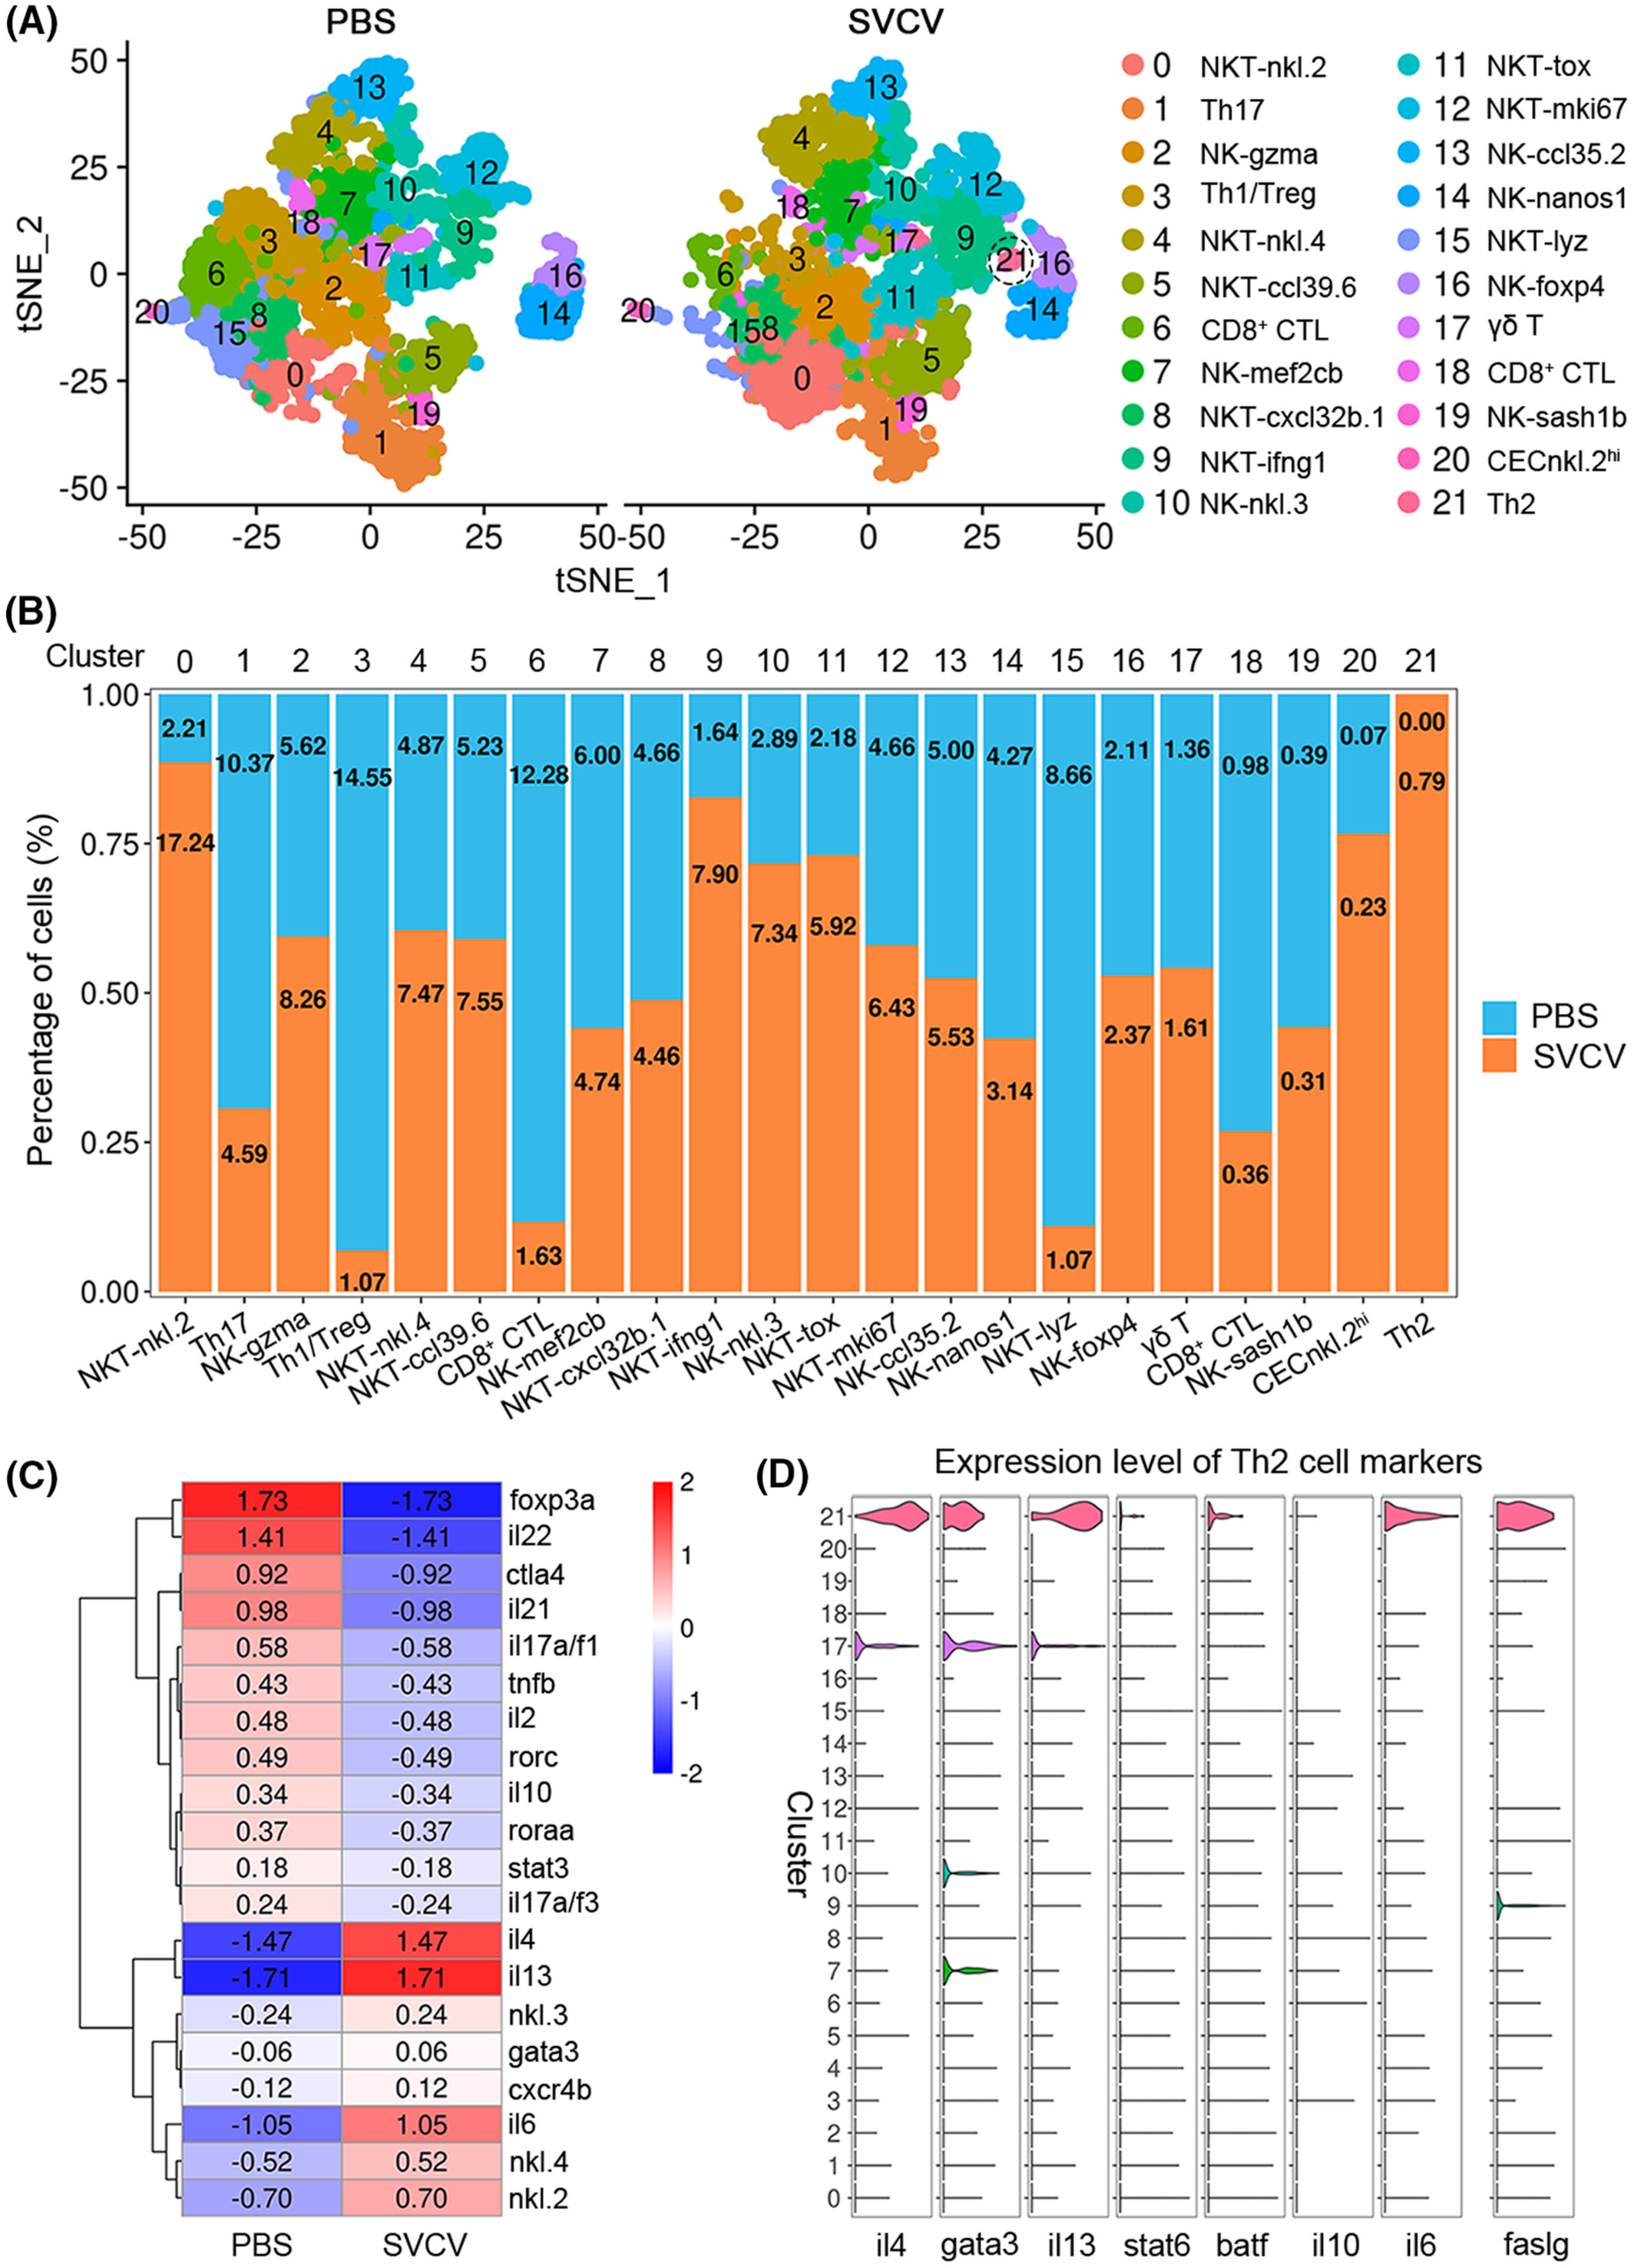
Fig. 10 Change in T/NK-cell subtypes in response to SVCV infection. (A) Graph-based clustering of T/NK cells showing 21 subclusters in the control group (PBS) and 22 subclusters in the SVCV-infected group. tSNE nonlinear clustering was used to visualize the differences in the classification results of the zebrafish spleen leukocyte population between the control group and the SVCV-infected group. Th2 cells in the SVCV-infected group are denoted by dotted circles. (B) Histogram showing the differences in T/NK-cell ratios between the control group and the SVCV-infected group. (C) Heatmap of the significantly differentially expressed marker genes in T/NK-cell subsets between the control group and the SVCV-infected group. The gene names are shown on the right. (D) Violin plots of Th2 cell marker genes distributed in all clusters. Gene expression was normalized, and each graph represents the average expression of the gene in each cluster.