
|
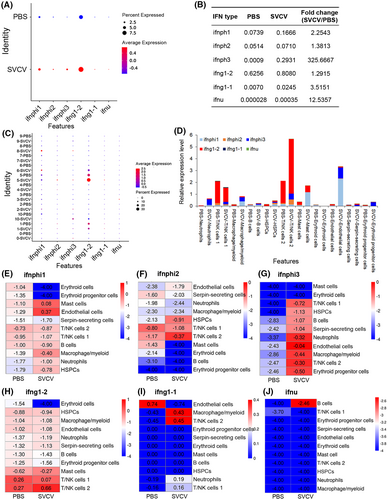
Fig. 13 Analysis of IFN-producing immune cell types before and after SVCV infection. (A) Dotplots showing the six types of IFNs that were significantly up-regulated during viral infection and differentially expressed in zebrafish spleen leukocytes. (B) Average expression level of six IFN genes in all leukocytes between the control (PBS) and SVCV-infected zebrafish spleen. (C) Dotplots of the six IFN genes that are differentially expressed in each cluster of leukocytes between control and SVCV-infected zebrafish. (D) Histogram of the six types of IFNs that are differentially expressed in each cluster of leukocytes between control and SVCV-infected zebrafish. (E–J) Heatmap of six IFN genes that are differentially expressed in each cluster of leukocytes between the control and SVCV-infected zebrafish.