
Image
|
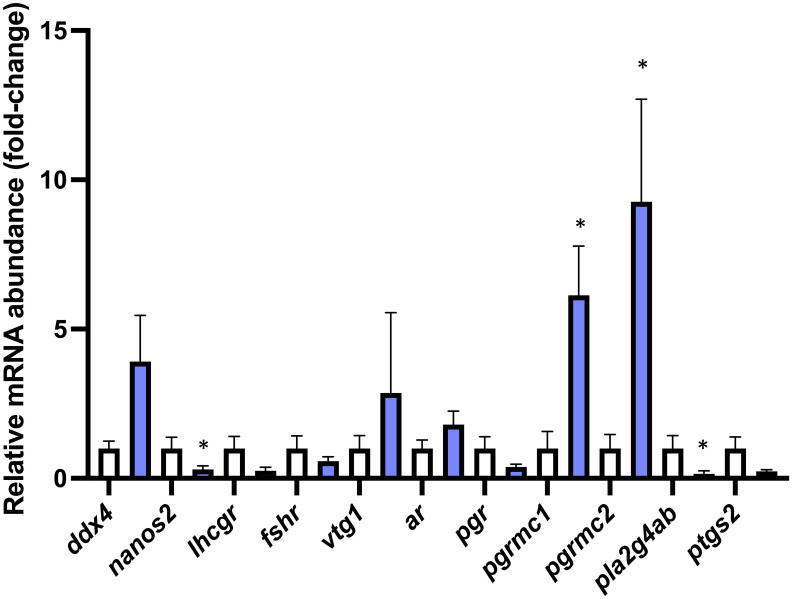
Figure Caption
Figure 7
Targeted gene expression analysis of selected transcripts with characterized roles in different stages of oocyte development in WT (n=7) and
Acknowledgments
This image is the copyrighted work of the attributed author or publisher, and
ZFIN has permission only to display this image to its users.
Additional permissions should be obtained from the applicable author or publisher of the image.
Full text @ Front Endocrinol (Lausanne)