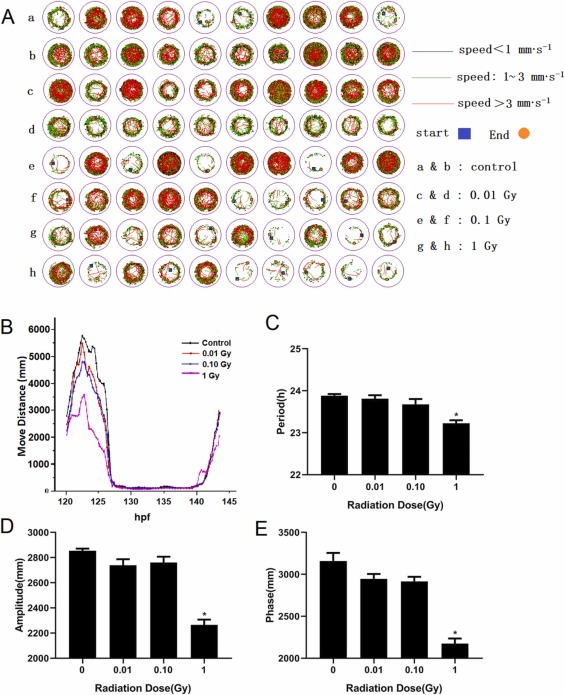
Fig. 3
Fig. 3. Effects of different doses of gamma radiation on the movement rhythm of zebrafish embryos (120 hpf).(A) Changes in zebrafish motion trajectories under different irradiation doses in 96 well plates. a-h represents the different irradiation dose groups. The color of the line segment represents the speed, the black line represents low speed movement, the green line represents medium speed movement, the red line represents high speed movement, and the length of the line segment represents the swimming distance of the fish. (B) Changes in the activity speed of juvenile zebrafish in each group. (C) Exercise cycle, motion cycle refers to the time corresponding to the two peaks of motion trajectory. (D) Amplitude, meaning the maximum distance from the equilibrium position. (E) Phase, which refers to the position at a specific time in the wave period; * P < 0.05.

