
|
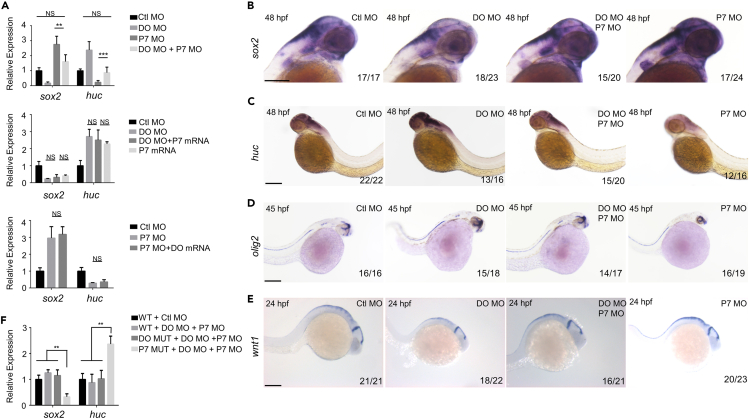
Figure 7
Dopey2 and Pcdh7b complement the development and arrangement of neural cells in zebrafish embryonic brains
(A) Real-time fluorescence quantitative PCR analysis shows the relative expression level of sox2, huc at 48 hpf in embryos pre-inject with Ctl MO, DO MO, P7 MO, DO MO + P7 MO, DO MO + P7 mRNA, P7 mRNA, and P7 MO + DO mRNA (mean ± s.e.m, n = 3, Student’s t test: ∗∗∗p < 0.001, ∗∗p < 0.01, ∗p < 0.05).
(B–E) ISH analysis of sox2, huc, olig2 and wnt1 for embryos at 48 hpf, 45 hpf and 24 hpf pre-injected with Ctl MO, DO MO, P7 MO and DO MO + P7 MO. Scale bar = 200 μm.
(F) Real-time fluorescence quantitative PCR analysis shows the relative expression level of sox2, huc at 48 hpf in WT, DO MUT or P7 MUT embryos pre-inject with Ctl MO, DO MO + P7 MO (mean ± s.e.m, n = 3, Student’s t test: ∗∗p < 0.01). Ctl MO: control MO, DO MO: dopey2 MO, DO mRNA: dopey2 mRNA, P7 MO: pcdh7b MO, P7 mRNA: pcdh7b mRNA, DO MUT: dopey2mutant, P7 MUT: pcdh7bmutant.