IMAGE

Figure 7

ID
ZDB-IMAGE-230122-36
Source
Figures for Keseroglu et al., 2023
Image
Figure Caption

Figure 7

Example outcomes of images, RNA and variability (noise) distributions

(A–N) (A) Masked nucleus (blue) and membrane (green) frames, and 3D projection of
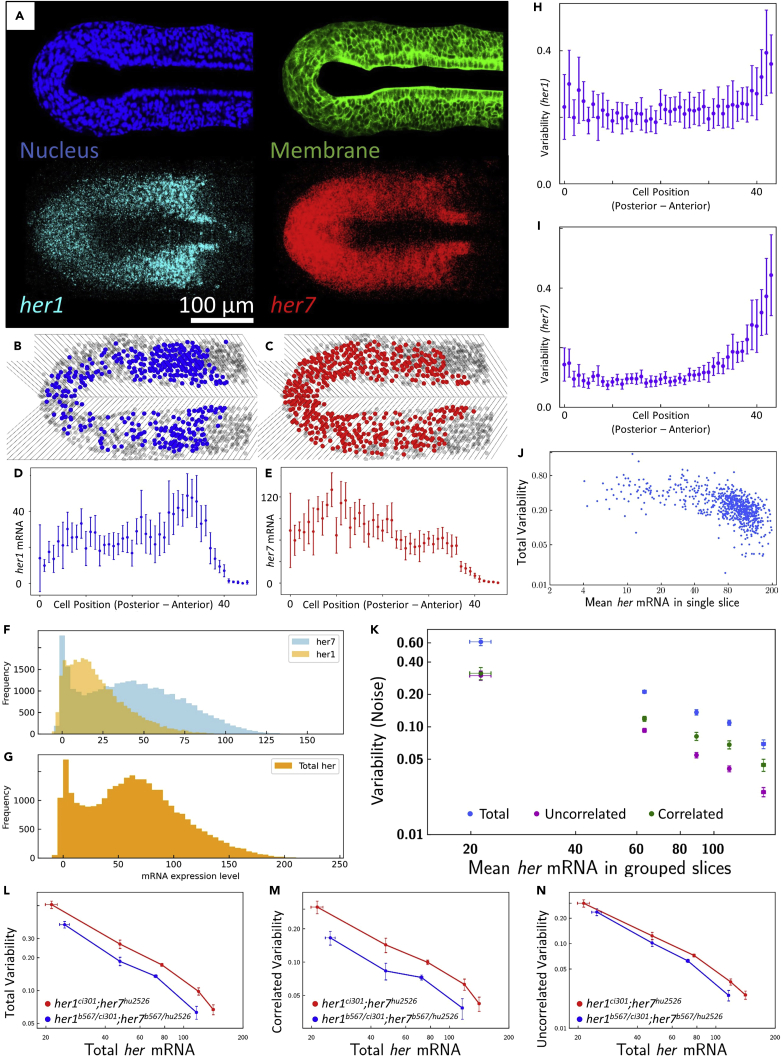
 her1 (cyan) and her7 (red) transcripts of a her1ci301;her7hu2526 mutant embryo. Scale bar is 100 µm. (B) and (C) show heatmaps of cells containing her1 (blue) and her7 (red) that are higher than an arbitrary threshold in single-cell-wide slices, respectively. (D) and (E) show her1 (blue) and her7 (red) RNA distribution along the posterior-anterior axis of the right-side of the embryo. Error bars are two standard errors of mean (SEM). (F) and (G) show the frequency histograms of her1 (transparent orange) and her7 (transparent blue), and total her (opaque orange) RNA expression per cell of her1ci301;her7hu2526 mutant embryos (n=17, N=2), respectively. N is the number of independent experiments; n is the number of embryos. (H) and (I) show the average transcription variabilities of her1 and her7 per slice along the posterior-anterior axis. Error bars are two SEM. (J) shows total variability of mean her RNA levels of each single slice. (K) shows average of total (blue), correlated (green), and uncorrelated (purple) variabilities versus binned mean her RNA levels of slices. Error bars are two SEM. (L), (M), and (N) show total, correlated, and uncorrelated variability plots of multiple genetic backgrounds, her1ci301;her7hu2526 (red, n=17, N=2) and her1b567/ci301;her7b567/hu2526 (blue, n=12, N=2) mutant embryos. Adapted from Zinani et al.3 N is the number of independent experiments; n is the number of embryos. Error bars are two SEM.

Acknowledgments
This image is the copyrighted work of the attributed author or publisher, and ZFIN has permission only to display this image to its users. Additional permissions should be obtained from the applicable author or publisher of the image. Full text @ STAR Protoc