Fig. 7
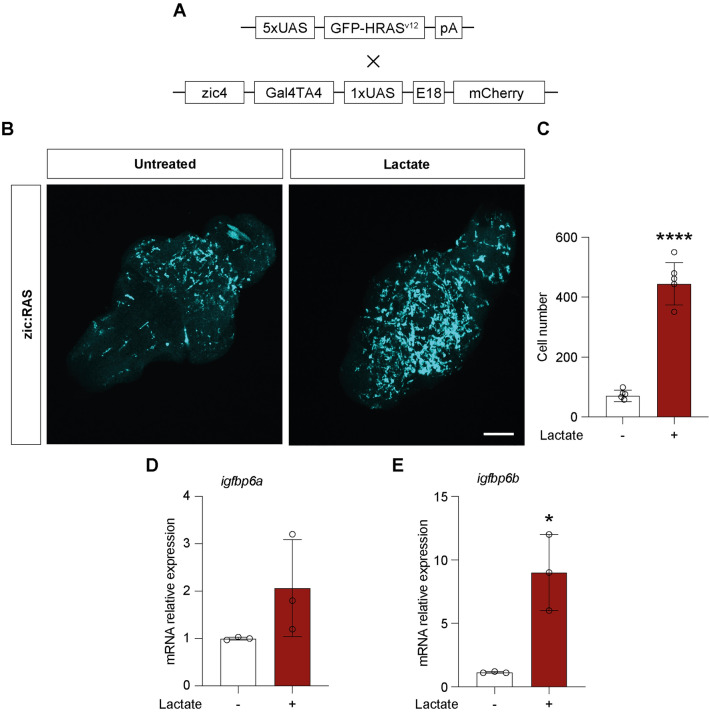
Lactate induces changes in microglia and igfbp6b expression in a zebrafish brain tumor model A Schematic representation of the genetic components of the zebrafish GBM model; B whole mount immunofluorescence of microglia (cyano) in zic:Ras larval brains treated as indicated; C count of microglia cells in whole zic:RAS control brains and treated with 20 mM lactate, data represent the means of counts performed on 5 biological replicates for each condition; d) gene expression analysis of igfbp6a and igfbp6b in 5dpf zic:Ras control larvae and treated with 20 mM lactate. (****P < 0.0001; *P < 0.01). Scale bar in B 40 μm

