IMAGE

Figure 6

ID
ZDB-IMAGE-221118-41
Genes
Source
Figures for Edirisinghe et al., 2022
Image
Figure Caption

Figure 6

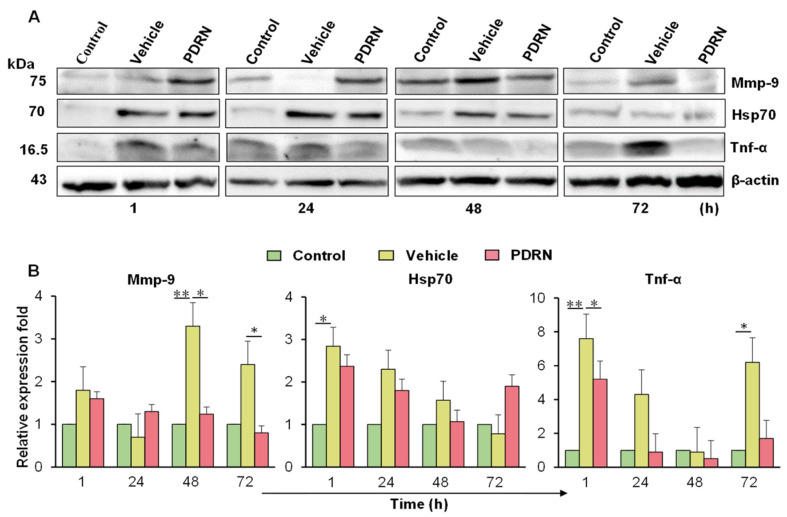
Immunoblot analysis of Mmp-9, Hsp70, and Tnf-α in response to corneal injury and PDRN treatment in zebrafish eye. (A) Western blot analysis images representing the specific protein bands that were expressed against the selected antibodies. (B) The pixel intensity of each protein band was quantified using Chemi Doc (Fusion Solo, Vilber, Lourmat, France) and normalized to β-actin. The relative expression fold was calculated based on the control group of each time point (one-way ANOVA was performed to find statistical significance; * p < 0.05; ** p < 0.01).

Figure Data
Acknowledgments
This image is the copyrighted work of the attributed author or publisher, and ZFIN has permission only to display this image to its users. Additional permissions should be obtained from the applicable author or publisher of the image. Full text @ Int. J. Mol. Sci.