
Fig. 2
|
Fig. 2
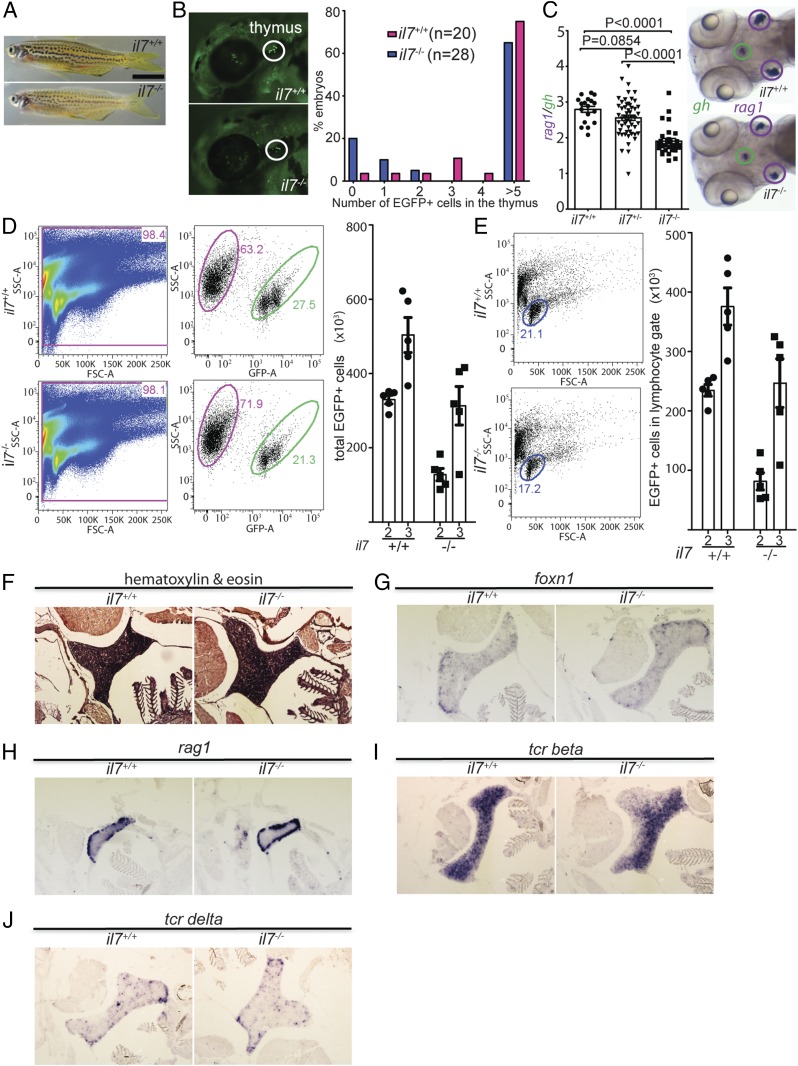
Characterization of il7 mutant zebrafish. (A) Normal gross appearance of adult wild-type (il7+/+) and mutant (il7−/−) fish. (B) Reduced number of ikaros-expressing lymphocytes in the thymus of il7-mutant fish also transgenic for an ikaros:eGFP reporter allele. (Left) Representative animals at 72 hpf. (Right) Quantitative assessment of cell numbers in the thymic rudiment. (C) Reduced thymopoietic activity in il7 mutants as determined by the thymopoietic index (Left) derived from quantitative analysis of whole- mount RNA in situ hybridization experiments (Right). Each data point represents 1 fish; data are mean ± SEM. (D, Left) Flow cytometry analysis of GFP-positive cells present in the thymus of wild-type and il7 mutant fish at age 2 mo. (D, Right) Enumeration of the total number of GFP-positive cells in the thymus at age 2 and 3 mo. Each data point represents 1 fish; data are mean ± SEM. (E) Enumeration of the total number of GFP-positive cells with light-scatter characteristics of lymphocytes (encircled; age 2 mo) (Left) in the thymus at age 2 and 3 mo (Right). Each data point represents 1 fish; data are mean ± SEM. A comparison of the data in D and E indicates that the majority of GFP-positive cells in the thymus are lymphocytes. (F) Normal histology of il7 mutant thymus in adult fish. (G–J) RNA in situ hybridization on tissue sections of adult wild-type and il7 mutant zebrafish thymus with probes specific for foxn1 (G), expressed by thymic epithelial cells; rag1 (H), indicative of immature thymocytes; tcr beta (I), indicative of αβ T cells; and tcr delta (J), indicative of γδ T cells.