
IMAGE
Fig. 4
Image
|
Figure Caption
Fig. 4
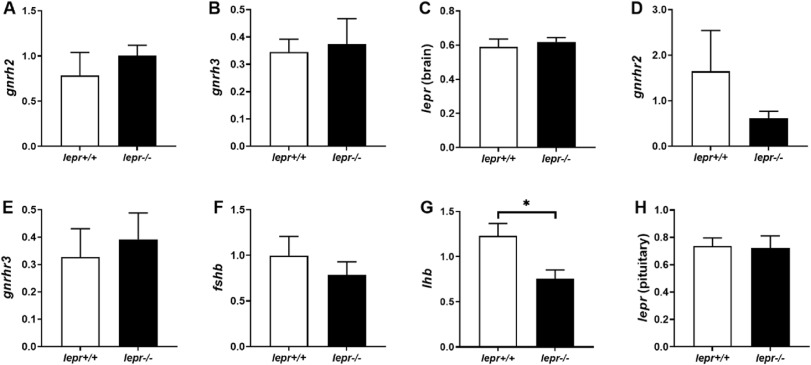
Fig. 4. Relative gene expression of gnrh2 (A), gnrh3 (B) and lepr (C) in the brain and of gnrhr2 (D), gnrhr3 (E), fshb (F), lhb (G) and lepr (H) in the pituitary of lepr+/+ (empty bars) and lepr−/− (filled bars) adult female zebrafish. Data shown as mean ± SE (n = 6). The expression levels of the target genes were normalized to the expression levels of g6pd in the brain samples and to the average of the expression levels of ef1a and rplp0 in the pituitary samples. Significant differences between different groups are indicated by *p < 0.05.
Figure Data
Acknowledgments
This image is the copyrighted work of the attributed author or publisher, and
ZFIN has permission only to display this image to its users.
Additional permissions should be obtained from the applicable author or publisher of the image.
Reprinted from Molecular and Cellular Endocrinology, 546, Tsakoumis, E., Ahi, E.P., Schmitz, M., Impaired leptin signaling causes subfertility in female zebrafish, 111595, Copyright (2022) with permission from Elsevier. Full text @ Mol. Cell. Endocrinol.