Fig. 3
Image
Figure Caption
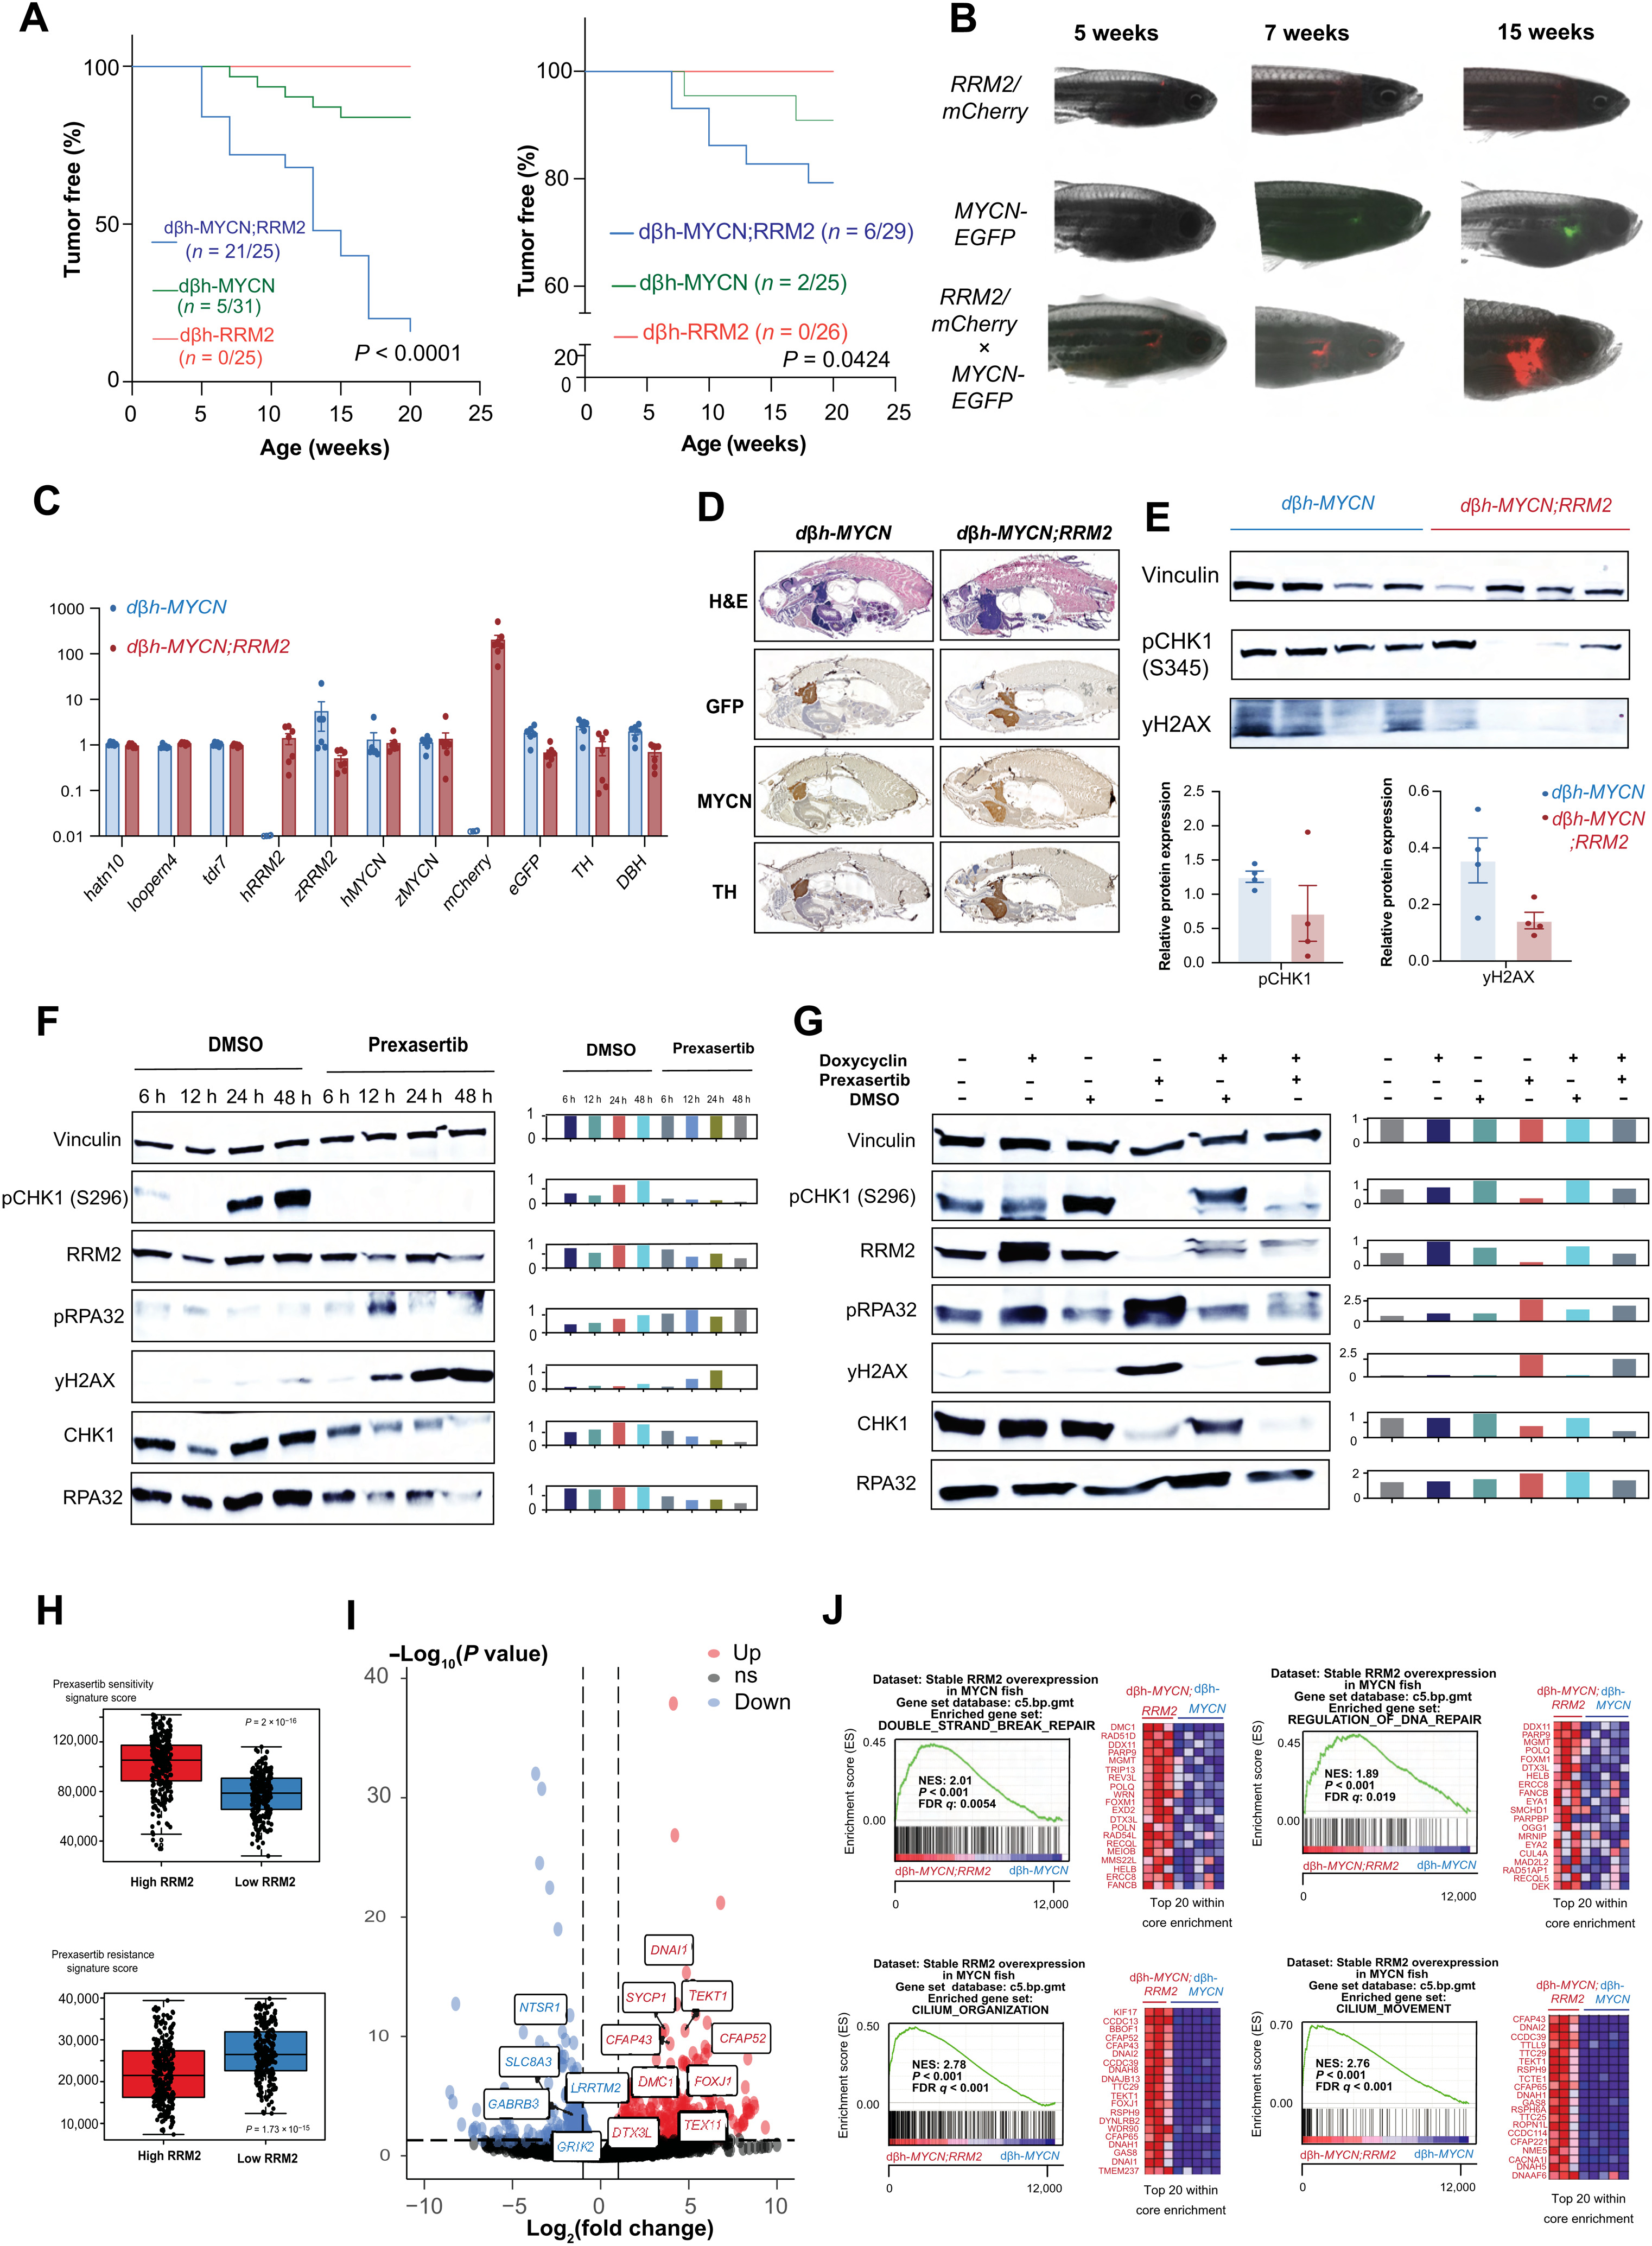
Fig. 3. Combined MYCN-RRM2 overexpression in zebrafish sympathetic neuroprogenitor cells results in accelerated neuroblastoma development and increased tumor penetrance versus MYCN-only fish.
(A) Kaplan-Meier analysis of dβh-MYCN;RRM2 double transgenic zebrafish (left) and the mosaic model expressing cmlc2-eGFP/dβh-RRM2 in dβh-MYCN zebrafish (right) both show significant accelerated neuroblastoma formation and strongly increased tumor penetrance compared to dβh-MYCN fish. (B) Fluorescence microscopy images show the development of neuroblastoma tumors over time in MYCN-only (GFP) or MYCN-RRM2 double transgenic fish (mCherry). (C) RT-qPCR analysis showing human RRM2 overexpression in the dβh-MYCN;RRM2 double transgenic zebrafish compared to MYCN-only fish. Tdr7, looprn4, and hatn10 were used as housekeeping genes in this analysis. (D) H&E staining and immunofluorescent staining for the markers GFP, TH, and MYCN (×10 magnification). (E) Immunoblotting for S345pCHK1 and yH2AX for protein samples derived from MYCN and MYCN-RRM2 zebrafish. (F) Left: Time course analysis of replication stress markers in CLB-GA neuroblastoma cells upon prexasertib exposure by immunoblotting. Right: Quantification of the immunoblotting relative to vinculin. (G) Left: Time course analysis of replication stress markers in CLB-GA neuroblastoma cells before and after doxycyclin-inducible RRM2 overexpression by immunoblotting. Right: Quantification of immunoblotting relative to vinculin. (H) Signature score analysis of publicly available prexasertib sensitivity and resistance gene signatures in a large primary cohort of neuroblastoma cases (GSE62564). (I) Volcano plot showing the set of significantly up-regulated (red) and down-regulated (blue) genes in dβh-MYCN;RRM2 double transgenic versus dβh-MYCN fish. (J) GSEA of the gene expression profiles using the C5 curated MSigDB gene sets of dβh-MYCN;RRM2 double transgenic versus dβh-MYCN fish shows a significant up-regulation of DNA repair and genes related to cilium organization and movement, while down-regulated gene sets were predominantly related to synapse transmission gene sets [see volcano plot in (I) (blue)].
Figure Data
Acknowledgments
This image is the copyrighted work of the attributed author or publisher, and
ZFIN has permission only to display this image to its users.
Additional permissions should be obtained from the applicable author or publisher of the image.
Full text @ Sci Adv

