
Image
|
Figure Caption
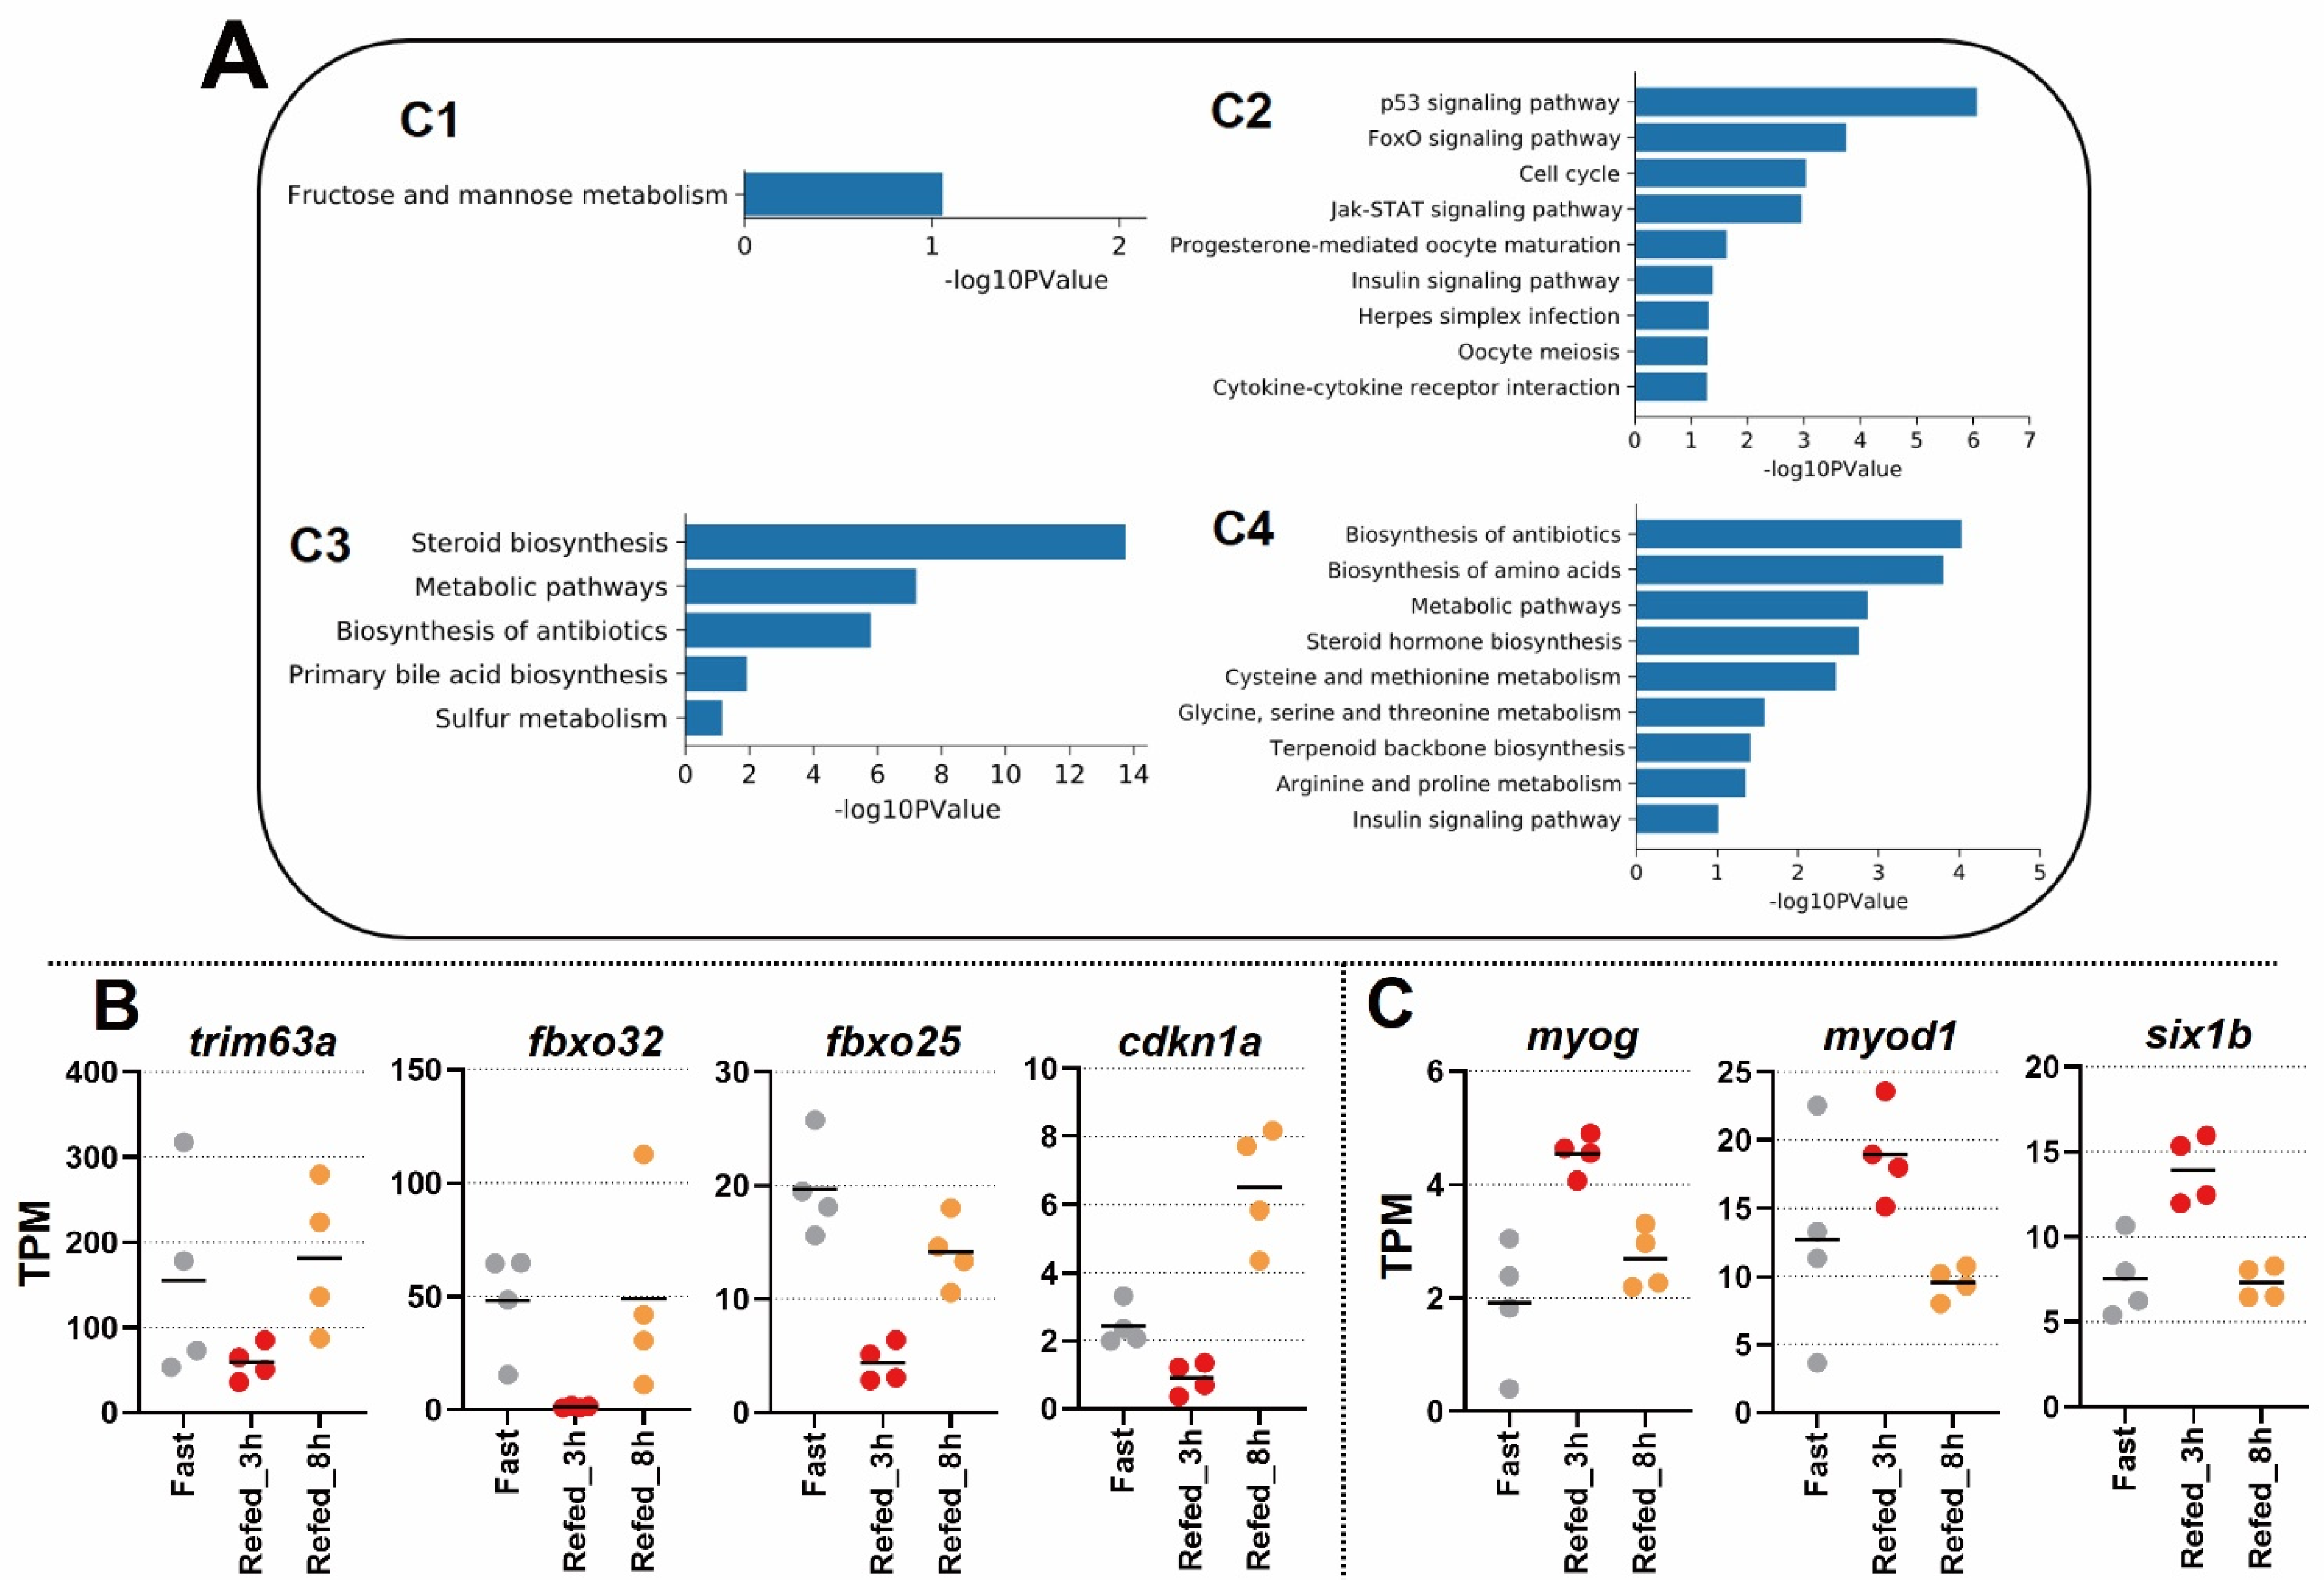
Fig. 4
Figure 4. Identification of most affected genes in muscle tissues by fasting-refeeding. (A) Heat map reflects expression values as z-score for 10 genes (5 genes of each condition) identified as most responsive genes to fasting-refeeding conditions. Each group (Fast, Refed_3h, Refed_8h) is represented by 4 individual samples. (B) Box plot depicts a z-score of 10 genes in each group. The box indicates the first to the third quartile, and the line indicates the median. The whiskers show the box with 5–95 percentile. (C) Scatter plot reflects averages of TPM + 1 values of each gene, shown as red dots. Numbers in parentheses indicate the fold change between the Fast and Refed_3h groups. Gray dots indicate non-DEGs; light blue dots indicate DEGs as FDR p-value < 0.05. (D) Plot graph represents TPM values of individual samples with “fasting genes” and “refeeding genes”. The TPM values of fasting genes are represented by Log10 notation. The bar indicates average mean. * p < 0.05; *** p < 0.001.
Acknowledgments
This image is the copyrighted work of the attributed author or publisher, and
ZFIN has permission only to display this image to its users.
Additional permissions should be obtained from the applicable author or publisher of the image.
Full text @ Nutrients